FY 2013 Congressional Budget Justification, Volume I, National Intelligence Program Summary, February 2012
Open PDFDocument date: 2012-02-01
Pages: 43
Genre: report
Banner: TOP SECRET//SI/TK//NOFORN
Classification: TOP SECRET SI TK
Dissemination: NOFORN
This document outlines the $52.6 billion “black budget,” detailing the structure, priorities, successes, and shortcomings of the 16 U.S. intelligence agencies. It reveals unprecedented insight into funding allocations, operations, and intelligence gaps—including the CIA’s dominant role, expanding cyber operations, and persistent challenges in areas such as North Korea and counterterrorism—while emphasizing the tension between secrecy and public accountability.
My notes
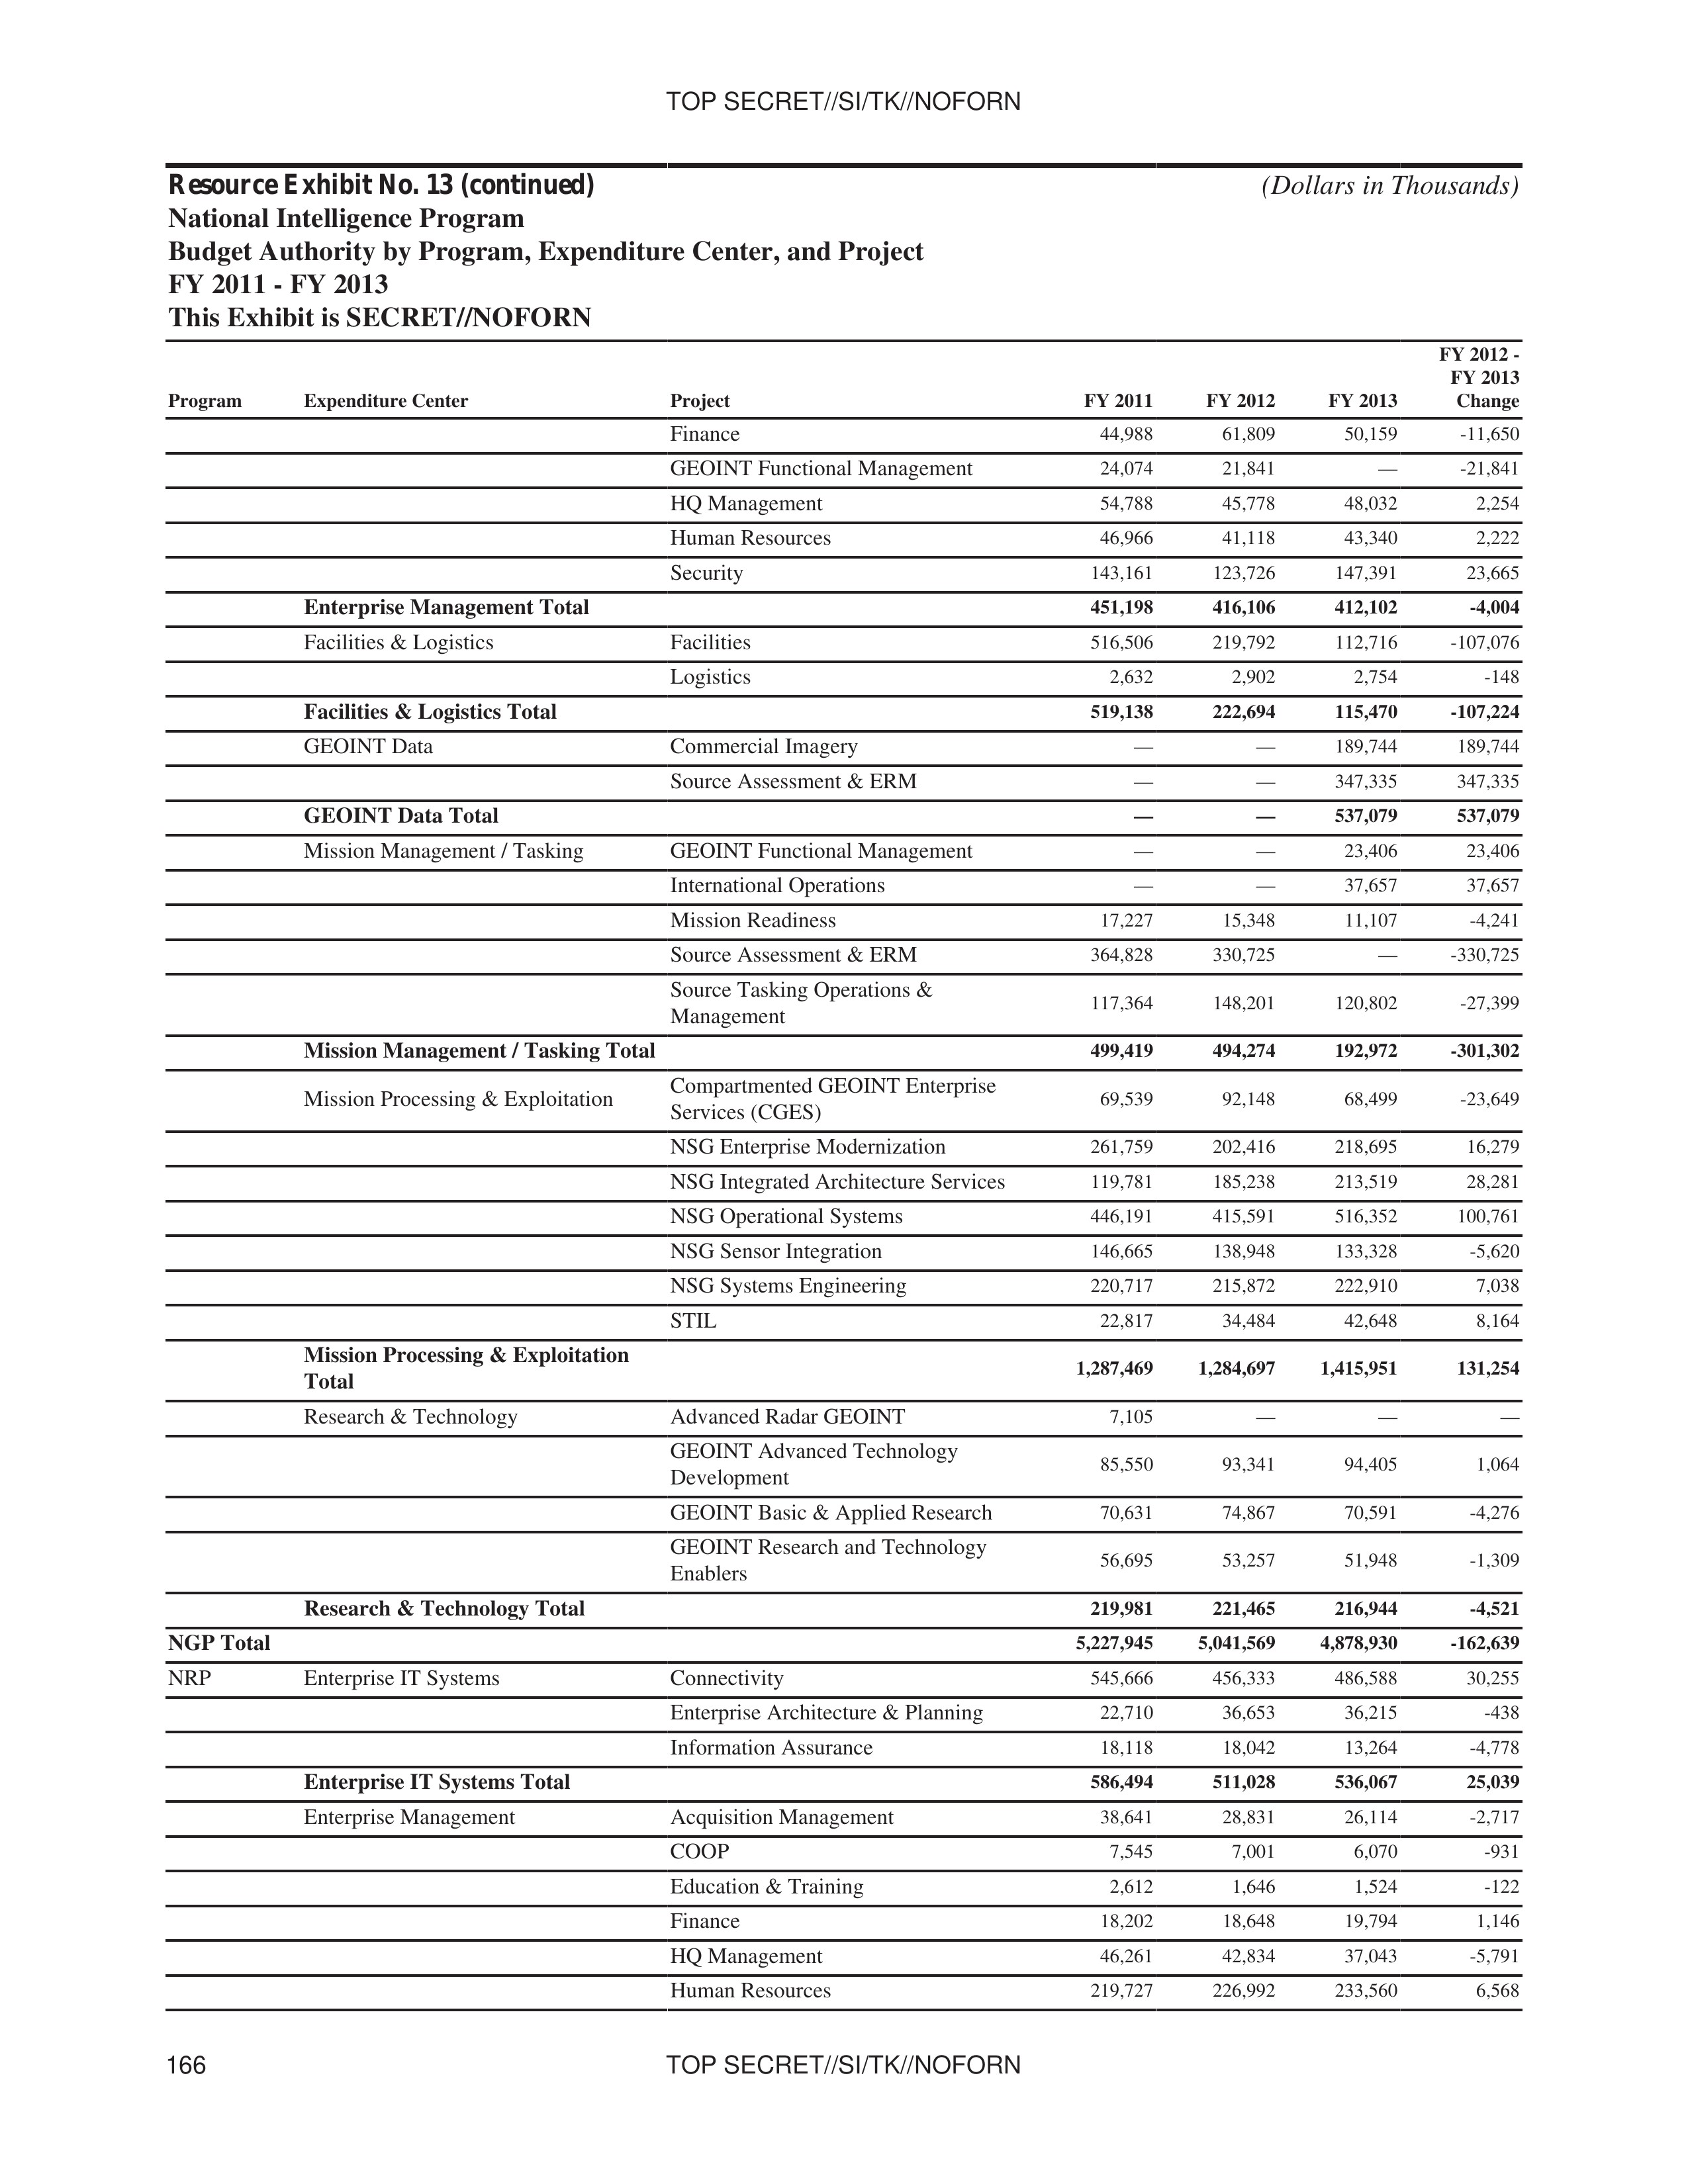
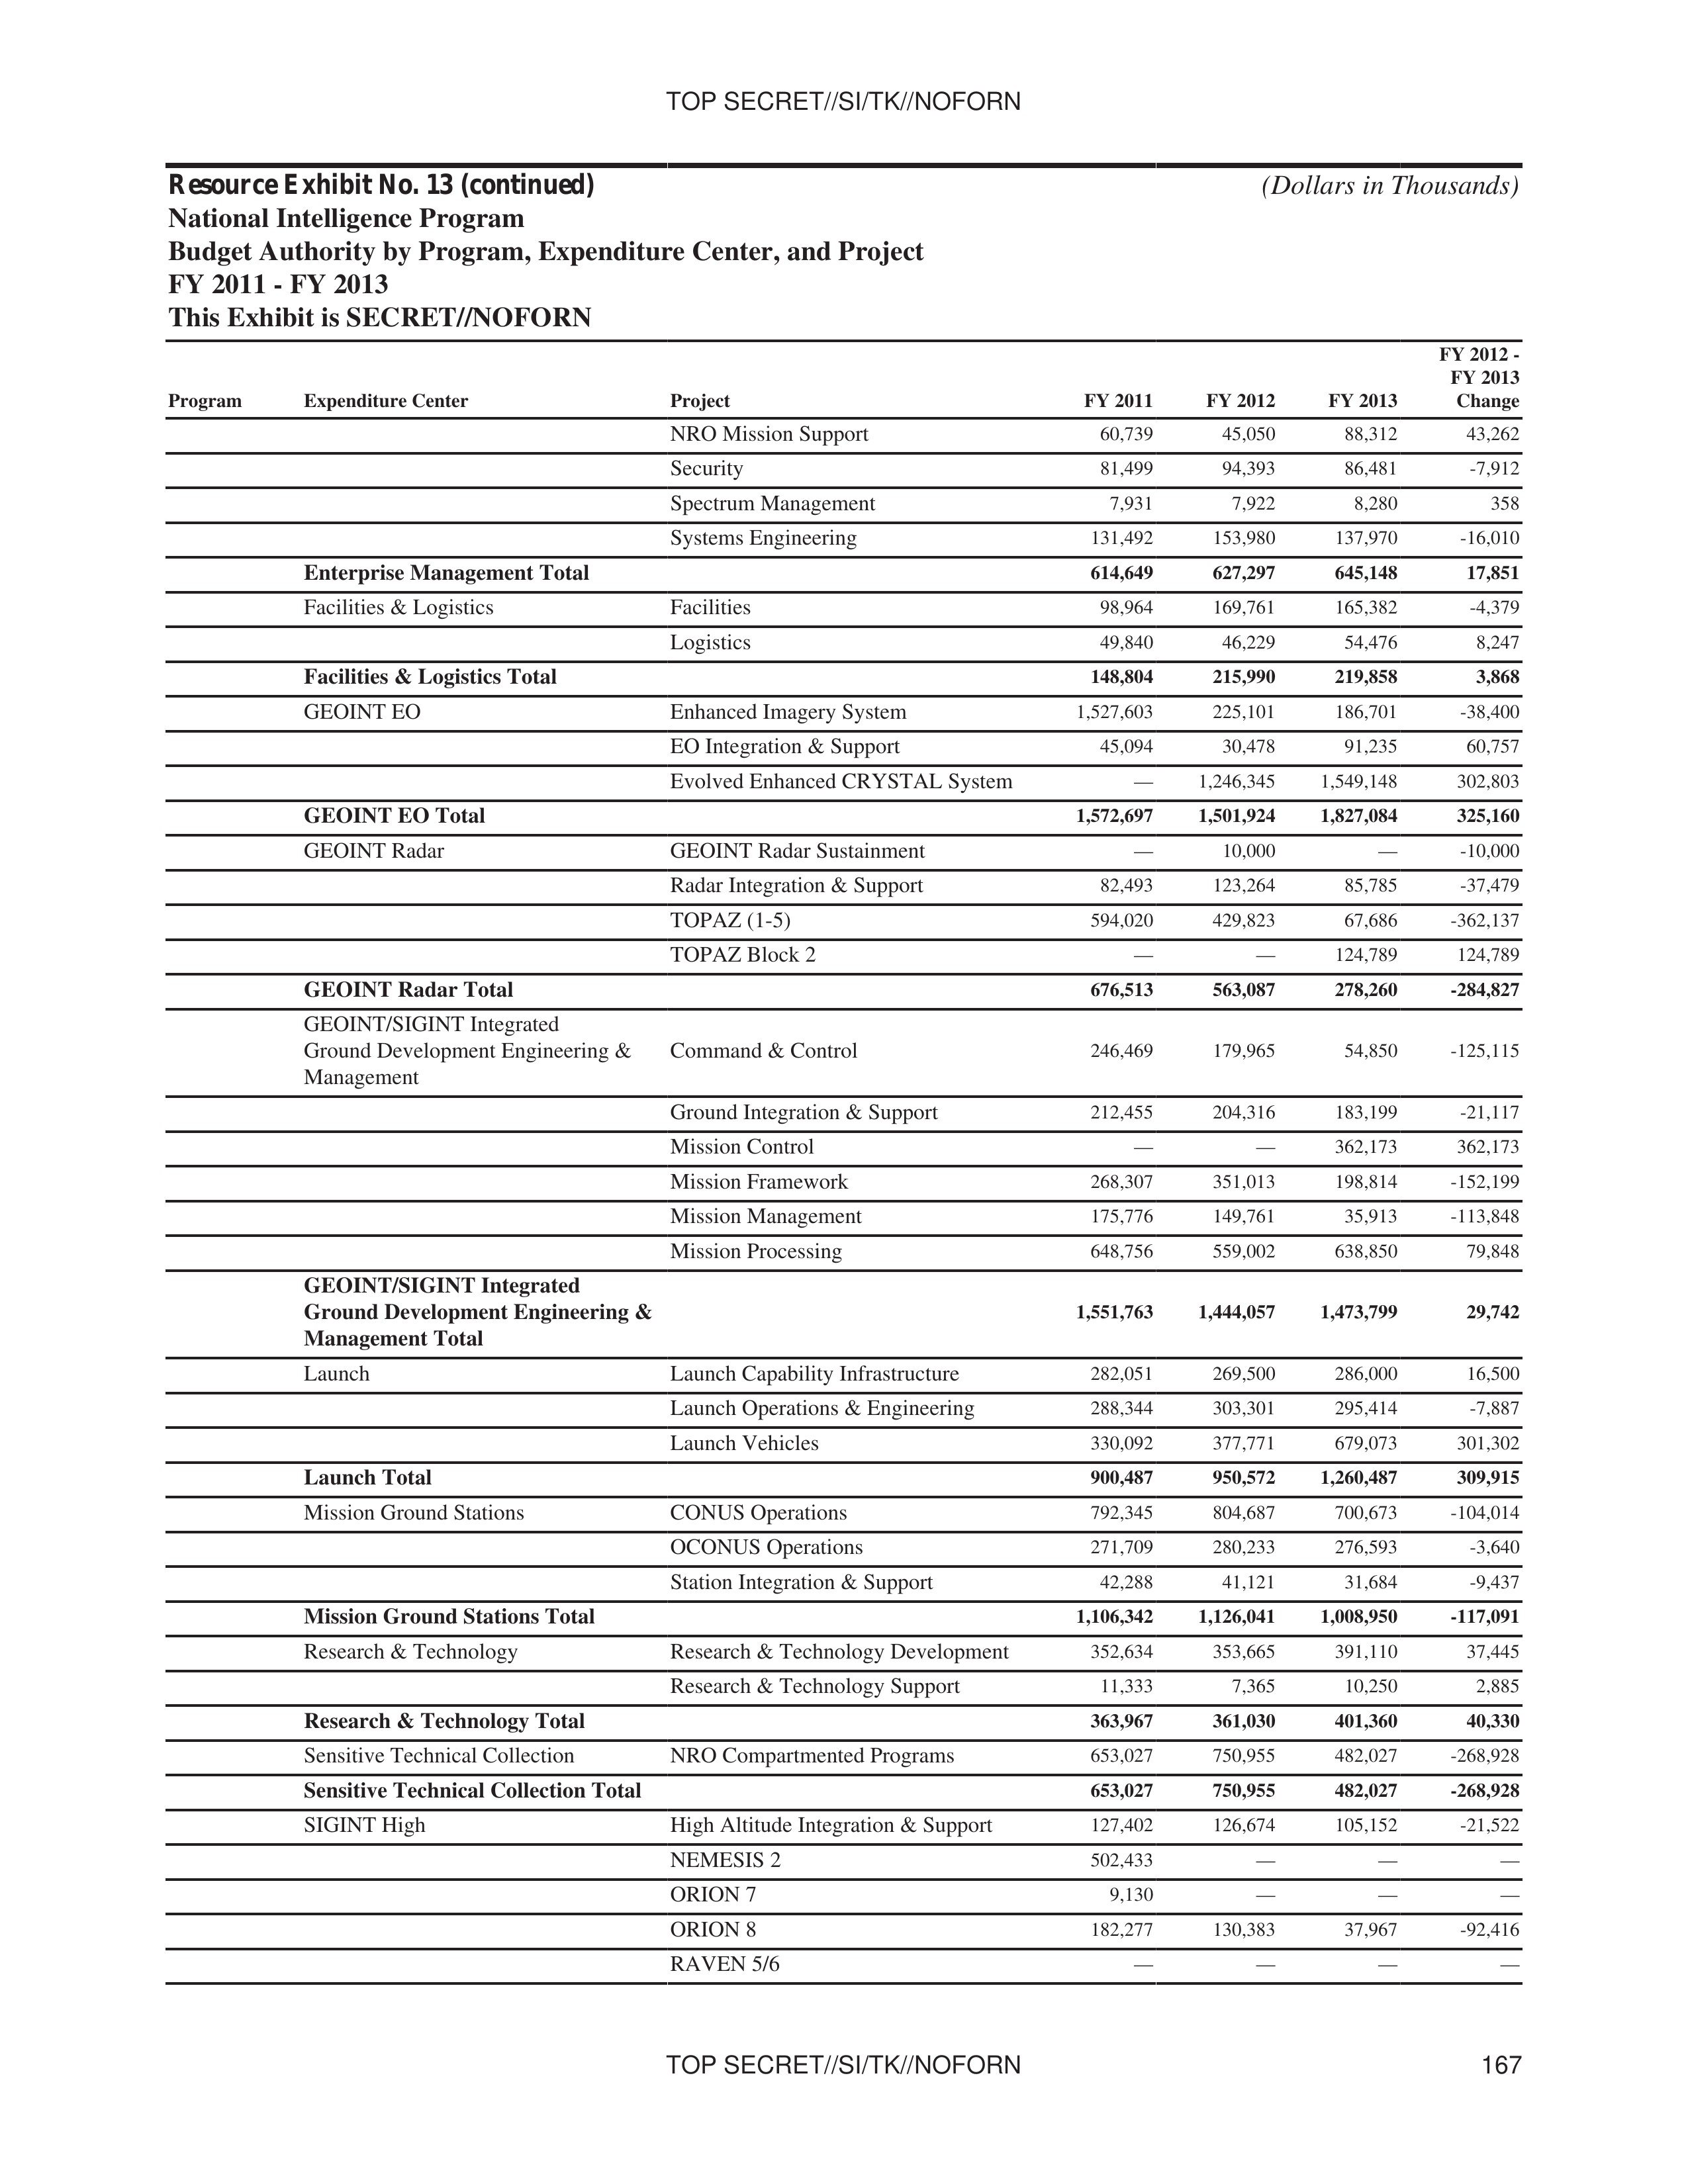
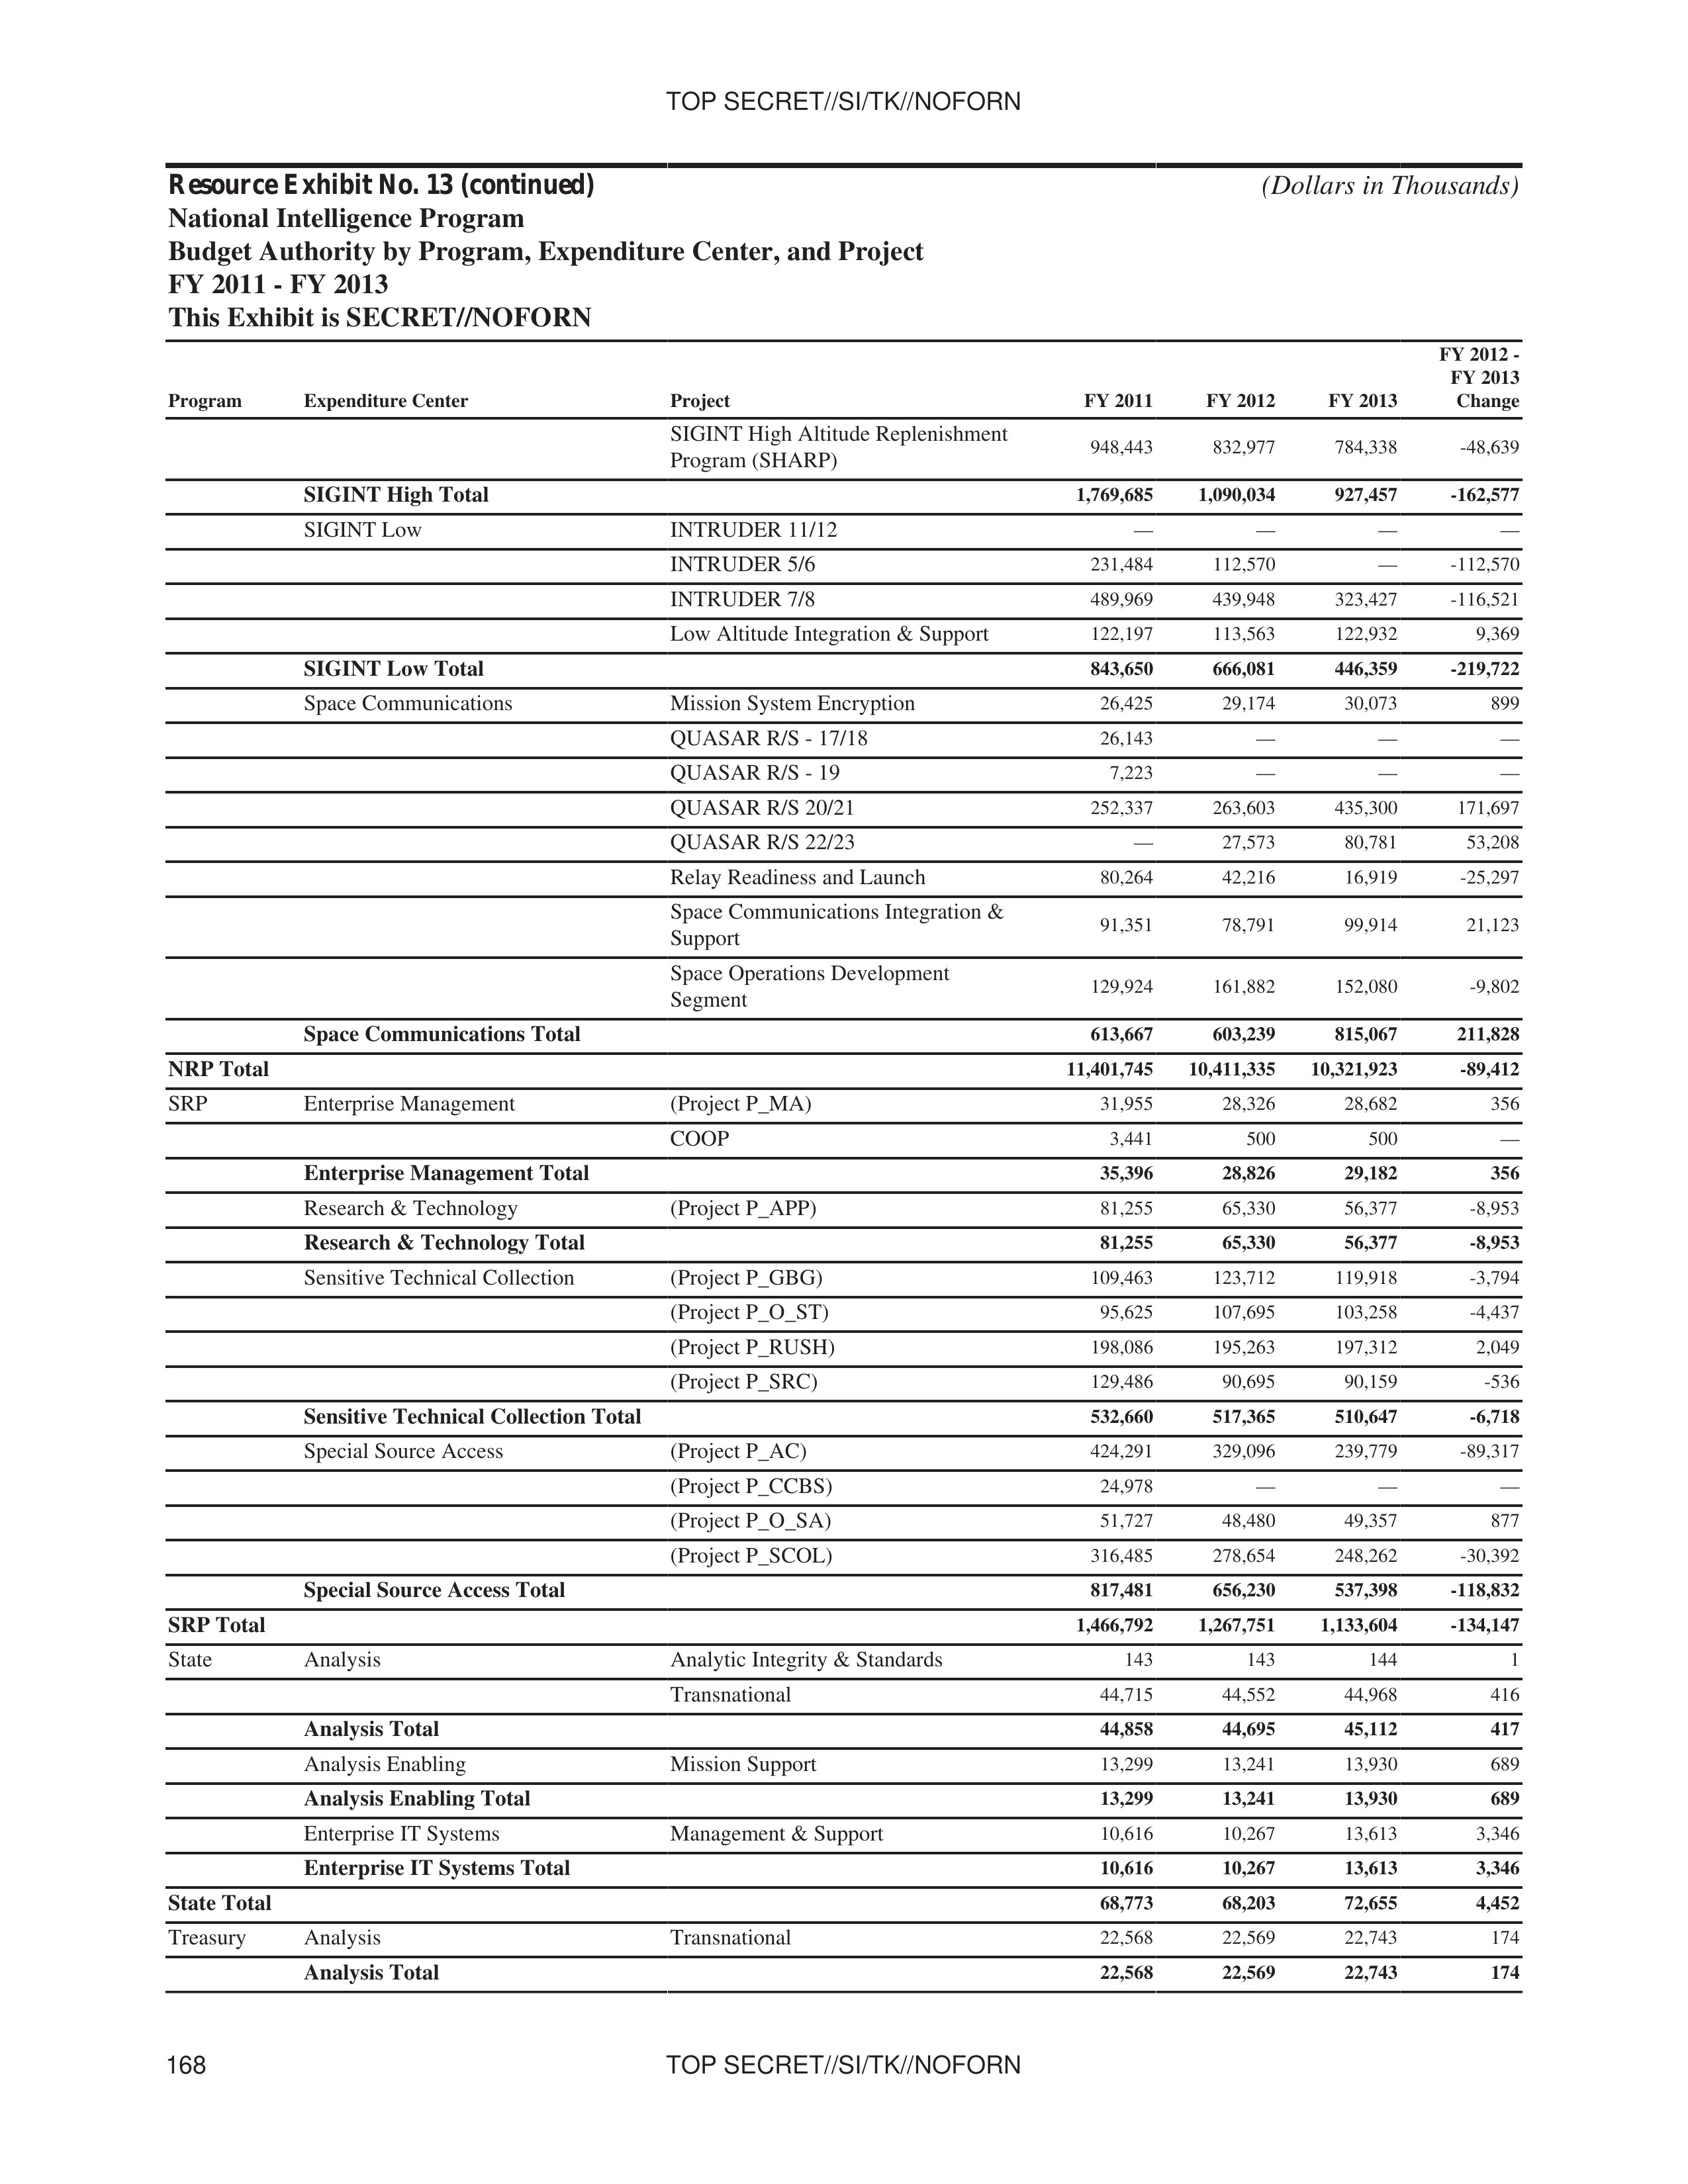
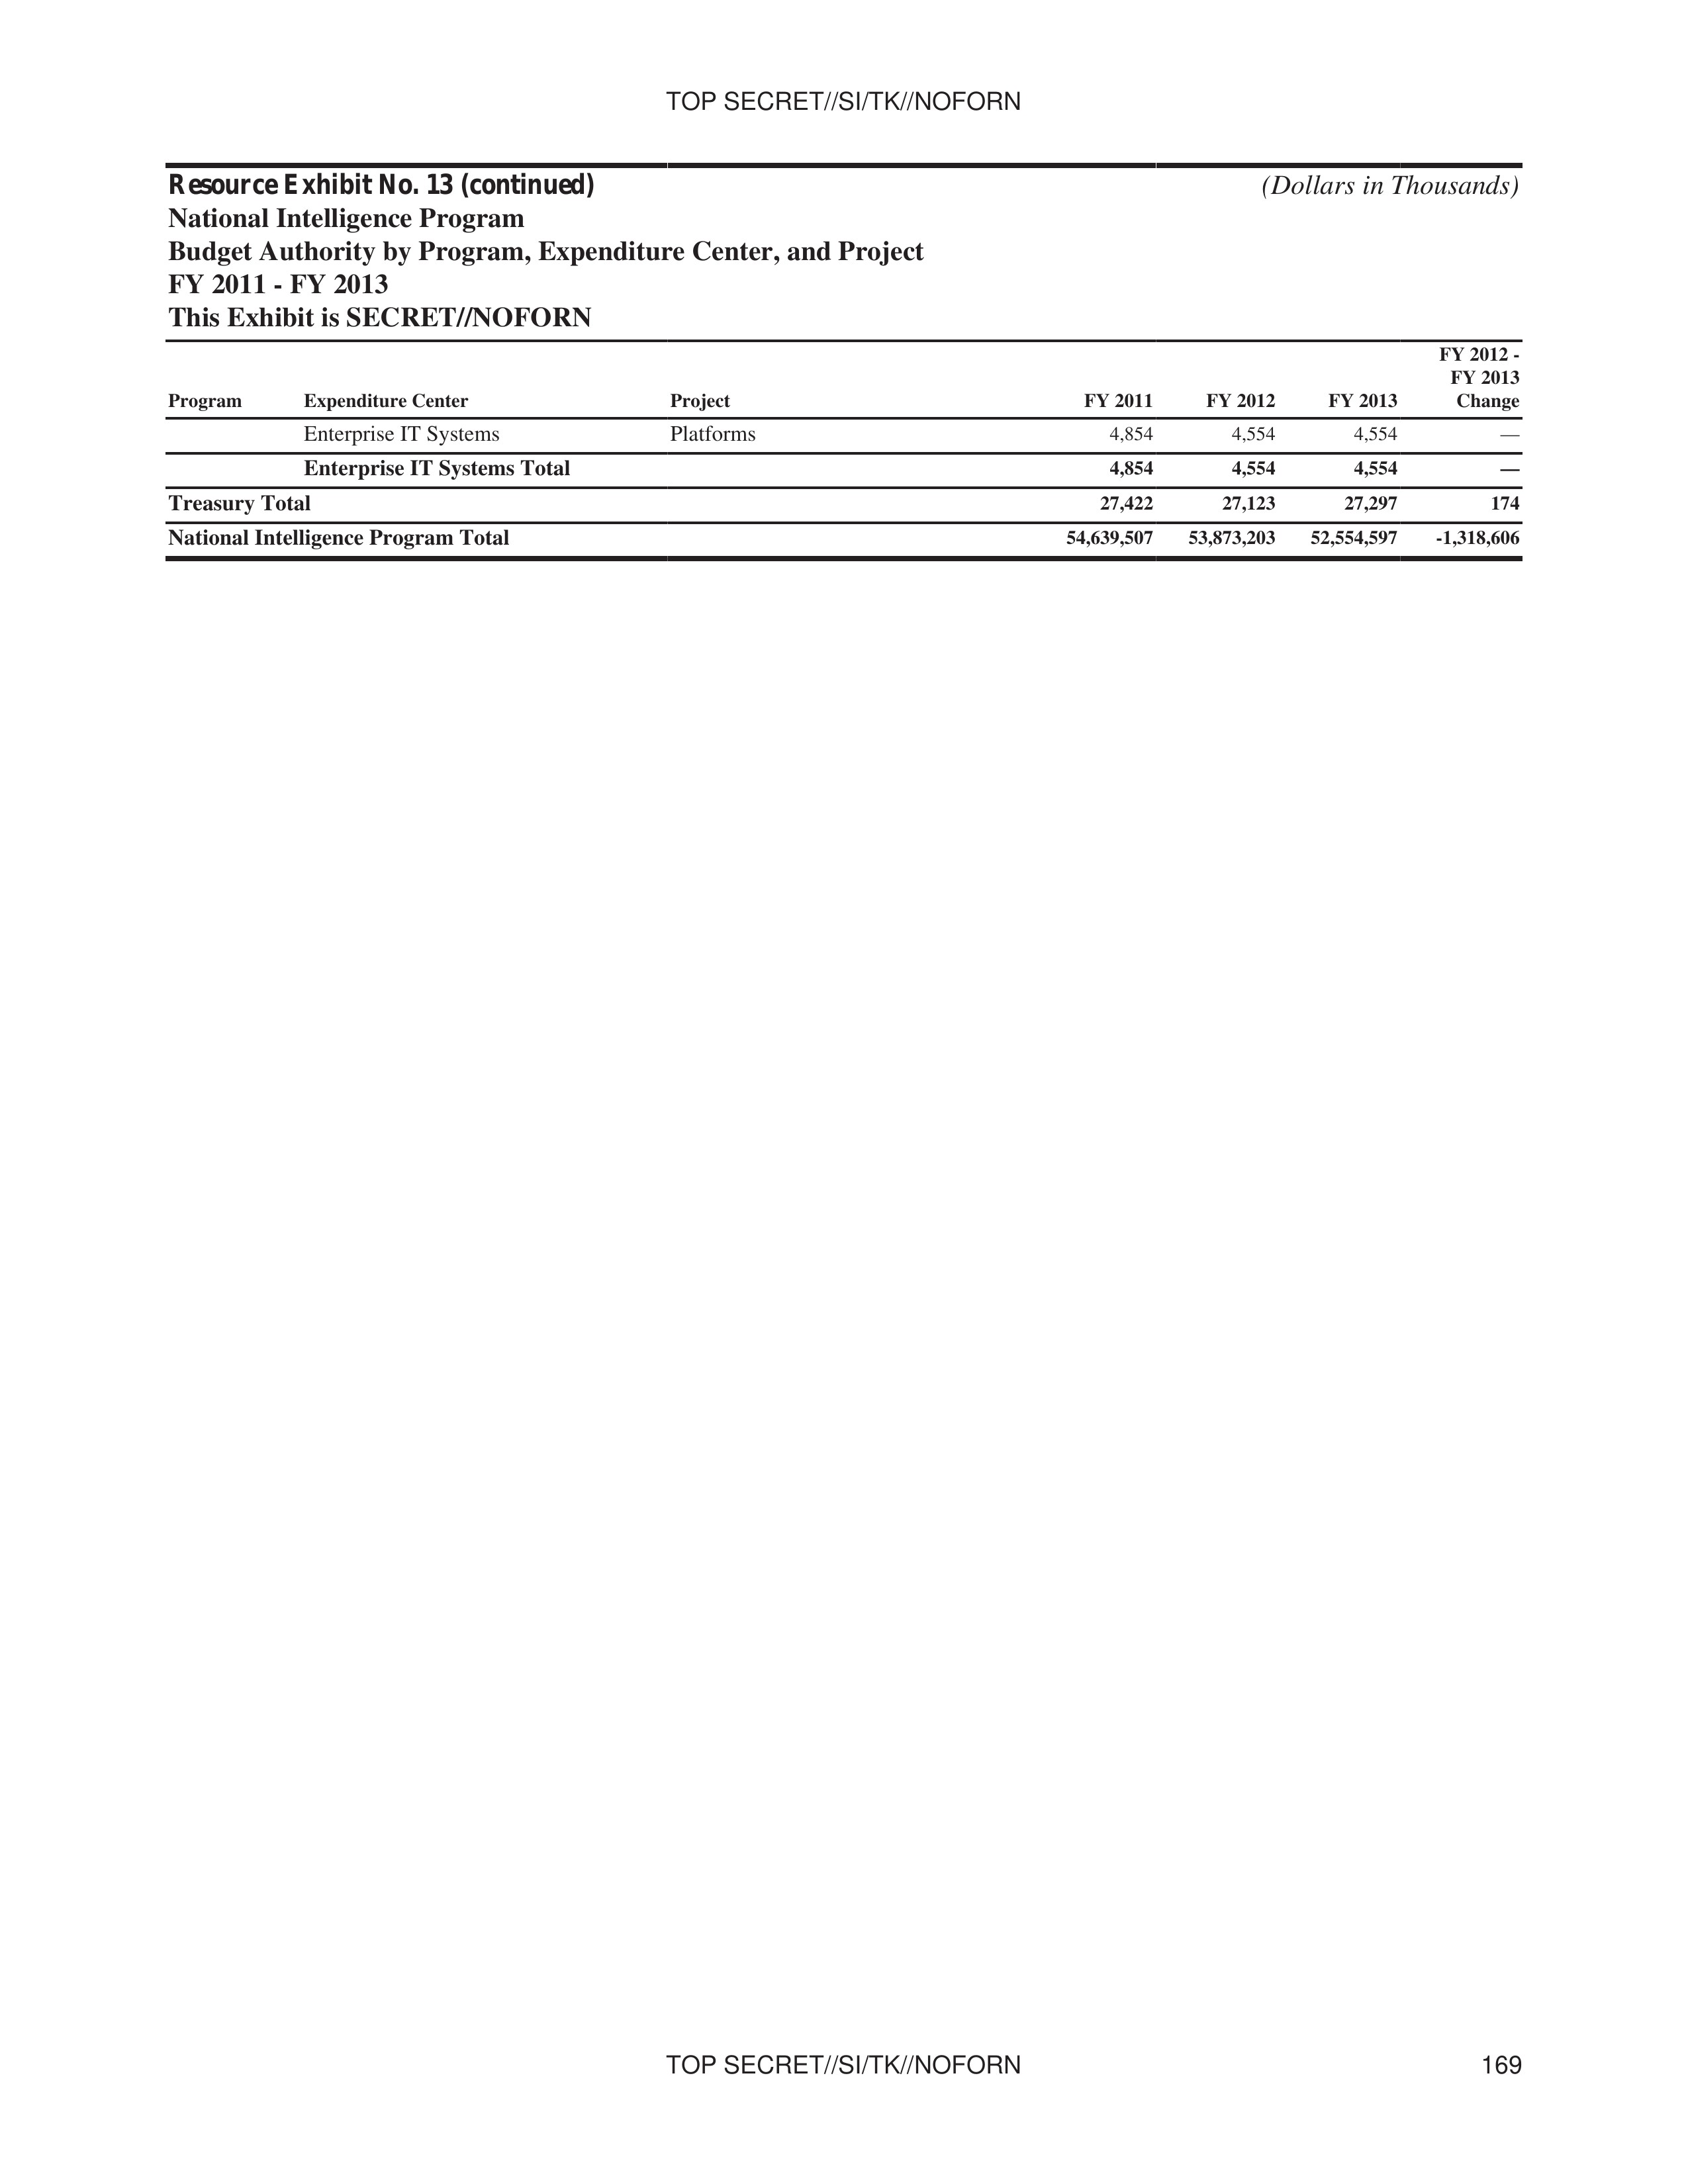
TOP SECRET//SI/TK//NOFORN
FY 2013
Congressional Budget Justification
Volume I
NATIONAL INTELLIGENCE PROGRAM SUMMARY
FEBRUARY 2012
[REDACTED]
TOP SECRET//SI/TK//NOFORN
TOP SECRET//SI/TK//NOFORN
Access to the information in this document
is restricted to US citizens with active SCI
accesses for SPECIAL INTELLIGENCE and
TALENT-KEYHOLE information.
DISSEMINATION CONTROL ABBREVIATIONS
NOFORN - Not Releasable to Foreign Nationals
This Component Budget of the National Intelligence Program is
produced pursuant to provisions of Executive Order 12333, as
amended by Executive Order 13470, and section 102A(c) of the
National Security Act of 1947, as amended.
NATIONAL SECURITY INFORMATION
Unauthorized Disclosure Subject to Criminal Sanctions
TOP SECRET//SI/TK//NOFORN
TOP SECRET//SI/TK//NOFORN
(U) DIRECTOR OF NATIONAL INTELLIGENCE STATEMENT
(U//FOUO) The Intelligence Community (IC) is crucial to ensuring the Nation's safety and security. We face
worldwide threats that are expanding in scope and complexity. This Fiscal Year (FY) 2013 National Intelligence
Program (NIP) budget reflects hard choices to ensure critical national security requirements are addressed in the
face of a reduced budget environment. We must be prepared to accept -- and manage -- reasonable risk.
(U//FOUO) Keeping America safe by providing the finest intelligence support to our policymakers, military,
law enforcement partners, and allies remains our highest priority. With the superb talent and ingenuity of our
workforce, the IC will continue to deploy the most technologically sophisticated and innovative intelligence
capabilities in the world. Through integration and efficiency, we will sustain responsive, insightful intelligence
support.
(S//NF) The FY 2013 NIP budget of $52.6 billion (including $4.9 billion for Overseas Contingency
Operations (OCO)) and 107,035 positions supports the National Intelligence Strategy and advances our Nation's
security priorities. This budget represents a decrease of $1.3 billion, or 2.4 percent, below the FY 2012 enacted
level; and it reduces personnel by 1,241 positions, or one percent. The request meets the fiscal demands laid out
in the Budget Control Act by setting the IC on a path to reduce expenditures by $25 billion for ten years; with
over $15 billion of that amount saved by FY 2017.
(U) Developing a Balanced Intelligence Budget
(S) The IC leadership worked as a corporate body to develop the budget. The team first drew on lessons learned
from the drawdown in the 1990s, which left the IC with a distorted workforce that lacked sufficient mid-career
personnel and technical expertise. As a result of that drawdown, the IC reverted to extraordinary measures to
rebuild and balance the workforce. Moreover, we deferred infrastructure recapitalization, resulting in obsolete
facilities, single point failures, and inadequate power, space, and cooling. We also delayed investment, reducing
our ability to keep pace with technical advances to meet mission needs.
(U) Second, we looked forward to determine how best to meet increasing mission requirements over the next
decade in a resource-constrained environment. The IC leadership weighed the relative merit of capabilities and
looked at dependencies across the components. In addition, we coordinated closely with the Defense and domestic
departments to minimize disconnects and ensure balance.
(S) At the outset, I determined that we would not take a proportional reduction from each IC program, but
rather compare relative merits of programs. We carefully weighed cost and risk to understand both the short
and long term impact of our actions. To maximize investments for the future, we focused reductions on lower
priority capabilities; sought efficiencies and smarter ways to do business; and prudently accepted risk. Overall,
this budget is guided by the imperative to achieve the right balance against competing demands. Our guiding
principles were to:
- (U) Sustain a skilled workforce;
- (U) Focus on further integration and collaboration;
- (U) Bolster agile capabilities that support multiple missions;
- (S) Enhance counterintelligence; and
- (U) Protect key investment for the future.
TOP SECRET//SI/TK//NOFORN
1
TOP SECRET//SI/TK//NOFORN
(U) Reductions
(U) To the extent possible, we protected the activities highlighted above; but with the magnitude of the
reduction, we could not avoid limited, targeted cuts to priority areas. The following are some activities reduced
from the base budget plan:
- (S//NF) Sustained Congressional Cuts. We sustain FY 2012 cuts to the CIA's Global Deployment Initiative
and NRO's Integrated Ground Architecture. - (S) Workforce. We continue Congressional reductions to the government workforce; curtail plans for future
personnel growth, and take targeted reductions to baseline personnel where the risk can be managed.
Furthermore, we reflect savings from a lower than projected civilian pay raise and continue to reduce our
reliance on core contractors. - (TS//NF) Operations. We decrease collection, production, and hard copy media generation in the GEOINT
system, slow SIGINT network exploitation and processing modernization; cut GDIP HUMINT, non-core
MASINT, covert action programs, and some Specialized Reconnaissance Programs (SRP) operations;
and streamline the ODNI business transformation activities. Furthermore, we discontinue or terminate
some lower-priority missions, such as de-orbiting the Baseline ONYX satellite and transferring funding
responsibility to the MIP for legacy satellites. - (S//TK//NF) Long-Term Investments. We are terminating an NRO compartmented project, delaying
TOPAZ performance enhancements until the second generation of TOPAZ satellites; and reducing
technology insertion opportunities in other satellites. In addition, we are delaying some SRP investments
and terminating the Community's investment in a consolidated human resources information system. - (S//NF) Infrastructure. We reduce enterprise management activities; eliminate the IC Data Center;
downsize the IC Bethesda Campus; suspend some facility improvements; and delay the replacement of
aged facility components. As a result, we will continue to house some of the IC workforce in older and less
capable facilities that may not meet current antiterrorism/force protection requirements and we will accept
some degradation in the IC's facility condition index. - (S//NF) Information Technology. We reduce capital equipment replacement and recapitalization; decrease
support for heritage systems; delay consolidation of older systems; and eliminate plans for additional backup
systems. These offsets prevent spending to sustain or improve legacy environments when our direction is
to establish a new IT environment based on more centralized common services. Investments required to
establish a more efficient IC IT Enterprise are protected.
(U) Investments
(U) Although the budget is declining, the mission is not. Prioritizing our requirements was a key element to
produce a budget that meets customer needs, supports critical capabilities, addresses gaps, and helps to maintain
a strategic advantage. In the FY 2013 NIP budget, the IC makes targeted investments in:
- (TS//SI//NF) Signals Intelligence (SIGINT). We are bolstering our support for clandestine SIGINT
capabilities to collect against high priority targets, including foreign leadership targets. Also, we are
investing in groundbreaking cryptanalytic capabilities to defeat adversarial cryptography and exploit
internet traffic. - (S//NF) Cybersecurity. As the cyber threat continues to grow, we sustain the budget for the Comprehensive
National Cybersecurity Initiative and begin construction of a second High Performance Computing Center
at Fort Meade, Maryland to keep pace with cyber processing demands.
TOP SECRET//SI/TK//NOFORN
2
TOP SECRET//SI/TK//NOFORN
- (TS//NF) Counterintelligence (CI). To further safeguard our classified networks, we continue to strengthen
insider threat detection capabilities across the Community. In addition, we are investing in target
surveillance and offensive CI against key targets, such as China, Russia, Iran, Israel, Pakistan, and Cuba. - (S//TK//NF) Major System Acquisitions (MSA). We are sustaining the acquisition baseline and maintaining
the schedule for the MSAs that replace current capabilities. For example, the NRO is modernizing overhead
SIGINT, geospatial, and communications major system acquisitions. To reduce reliance on the Tracking and
Data Relay Satellite System (TDRSS), the NRO begins investing in a special communications capability.
Also, launch requirements are fully funded. - (S//NF) Ballistic Missile Collection. We are pursuing an affordable MASINT solution for integrating,
improving, and sustaining coverage of and collection against North Korean, Iranian, Chinese, Russian,
Pakistani and other ballistic missiles threats. - (S//NF) Mission Focused Science & Technology (S&T). We continue investing in cutting edge S&T that
enables new mission capabilities. We are tackling hard problems in quantum computing, biometrics, cyber,
weapons of mass destruction, and large complex data sets.
(U) Optimizing Our Efforts
(U) To succeed, the IC must employ its resources judiciously. The need to integrate all elements of the IC
is essential to identify opportunities as well as dangers. In FY 2011, the elimination of Usama Bin Ladin along
with 32 other high value targets is just one testament to IC collaboration. Our ability to rapidly respond to
the requirements of Operation Unified Endeavor, while simultaneously maintaining support for operations in
Afghanistan, Iraq, and around the world, is another. We achieved this by reducing the cultural, technological and
policy barriers to sharing information, and exploring new strategies for integrating our intelligence efforts. The
FY 2013 budget sustains the imperative of integration, and provides the framework and common solutions to
further collaboration.
(U) Focusing on Integration
(U) The Office of the DNI has promoted information sharing and collaboration through the integration of
analysis and collection at the strategic level. This has improved mission management of key intelligence problems,
leading to a sharper focus on, and encouragement of, integration within the Community. The heightened attention
on intelligence integration has changed the dynamics of intelligence activities. Without requiring individual IC
elements to reorganize, the emphasis on integration has led Community elements to think and operate in ways
that are responsive to strategic management and direction that encourages, recognizes, and rewards integrated
intelligence operations.
(U//FOUO) The National Intelligence Managers (NIM) are the principal agents of mission integration. They
oversee and integrate all aspects of the IC's efforts against a particular regional or functional problem to provide a
more complete understanding of the associated issues. A major responsibility includes the development, planning,
execution, and oversight of Unifying Intelligence Strategies (UIS) for their individual accounts, with the principal
aim of managing the relevant policies, priorities, and relationships among the IC elements who participate in
each of these target domains.
(U//FOUO) These UIS are the instruments that are used to integrate IC efforts against critical priorities. Each
UIS supports decision-making by outlining gaps and challenges, as well as opportunities that would most benefit
from integration of IC efforts. In addition, the UIS present a select number of integration initiatives to provide
a holistic perspective across the strategies.
TOP SECRET//SI/TK//NOFORN
3
TOP SECRET//SI/TK//NOFORN
(U) Promoting Information Sharing
(U) Information sharing also is a critical enabler of integration across the Community. This budget begins to
implement a restructuring of the IC information technology (IT) architecture that will provide a strong backbone
enabling greater IC integration, information sharing, and improved safeguarding of networks. The need for the
IC to contribute to deficit reduction was the catalyst for achieving greater efficiencies in information technology.
The IC IT Enterprise will transform from agency-centric IT programs which are often duplicative and costly, to
greater centralization of common services for IC-wide use. Within this framework, we are leveraging existing
efforts across the Community and sustaining unique approaches only when they are essential to the mission.
Furthermore, we are investigating data management solutions and their associated security issues, such as the
viability of comingling data in virtualized data stores to facilitate analytical integration of different data from
different sources and Agencies. This includes new management and operating practices for the secure storage and
handling of the varied information contained in different intelligence systems through the use of cloud computing.
(U) Engaging Partners
(U) Expanding the IC's culture of sharing with our partners is essential to leverage and maximize our collective
capabilities. We are strengthening relationships with federal, state, local, tribal, and international partners to fuse
domestic and foreign intelligence to quickly understand and act on threats. Through coordinated efforts, we can
optimize our efforts to improve intelligence support.
(U) As part of the Administration's overall foreign trade initiative, the IC will more closely coordinate its
intelligence gathering and analysis efforts with federal agencies responsible for monitoring foreign trade barriers
and enforcing U.S. trade rights under international trade agreements. The IC will directly support and strengthen
U.S. interagency trade enforcement efforts to address unfair trade practices through the World Trade Organization
and under other domestic and international trade enforcement authorities
(U) Furthermore, the IC is postured to support the warfighter as the Department of Defense implements a new
strategy. The strategy is consistent with the IC approach to the FY 2013 budget. We will support the increased
focus on the Pacific region, and surge as needed for military operations. In addition, we expect there will be a
greater reliance on the IC to provide global coverage and warning of emerging threats.
(U) Aligning Resources
(U) This year, the IC implemented guiding principles to clarify responsibility for programming NIP resources.
(S) The IC developed guidelines to more clearly delineate programming responsibility for the NIP and the
MIP to further optimize resource allocation. These guidelines better align NIP and MIP resources with mission
requirements, reduce the number of split funded projects, and enable more efficient budget execution. The
FY 2013 budget begins to implement the guidelines by transferring $165 million and 1,078 positions between
the NIP and MIP. This transfer maintains the mission, function, and execution of activities; it does not represent
growth in either program.
(S) In addition, the DHS Office of Intelligence and Analysis (I&A) implemented a change in how it accounts
for resources that support the intelligence mission. Beginning in the FY 2013 budget, activities that predominately
support departmental missions are funded outside the NIP. Under the new methodology, $11 million and
44 positions are transferred out of the NIP.
(U) Supporting Current Intelligence Operations
(S//NF) In FY 2013, the IC will continue to provide crucial intelligence support to military operations in
Afghanistan and to combat terrorism worldwide.
(S//SI//NF) The request for Afghanistan and Pakistan decreases as support for the military's counterterrorism
and counterinsurgency operations declines, coincident with planned troop reductions. Accordingly, this request
sustains HUMINT and CI operations, along with the related analytic, processing, and exploitation capabilities.
TOP SECRET//SI/TK//NOFORN
4
TOP SECRET//SI/TK//NOFORN
Also, NSA is augmenting SIGINT access and penetration, and Treasury enhances threat finance analysis to track
terrorist and insurgent networks.
(TS//NF) With the completion of the military drawdown in Iraq, intelligence support transitions to a smaller
long-term presence. The IC's request is significantly reduced from FY 2012 as our support focuses on providing
foreign intelligence in support of diplomatic activities and monitoring Iraq's plans and intentions and those of its
volatile neighbor, Iran. This budget sustains HUMINT operations, with a smaller footprint, as well as SIGINT
collection capabilities. Most support for media exploitation, commercial imagery, and other operational enablers
is eliminated.
(TS//NF) The counterterrorism (CT) mission requires a global perspective to predict, penetrate, and preempt
global threats to U.S. security. Therefore, the IC is sustaining operations, analytic, and enabling activities. With
Yemen, Somalia, and other Horn of Africa countries emerging as the most recent breeding ground for terrorism,
the IC is increasing efforts in those regions. Furthermore, we are sustaining CT capabilities in Libya to deny
extremists a safe haven. In an effort to reduce our reliance on OCO as a funding vehicle, we transfer to the base
some enduring long term activities.
(S//NF) The counterproliferation (CP) mission continues to support a variety of actions to deter, disrupt, and
prevent proliferation. This includes improving our understanding of Pakistani nuclear weapons and dangerous
nuclear material security; intelligence on proliferators, such as Iran and North Korea, to roll back and block
weapons programs; increasing our ability to ascertain global chemical and biological threats; and better
integrating multidiscipline coverage of WMD targets such as chemical weapons in Libya and Syria.
(U) Moving Forward
(S//NF) Today's national security threats virtually defy rank-ordering. Capabilities, technologies, know-how,
communications, and environmental forces are not confined by borders, and can trigger transnational disruptions
with astonishing speed. Never before has the IC been called upon to master such complexity and so many issues
in such a resource-constrained environment. We are rising to the challenge by continuing to integrate the IC,
capitalize on new technologies, implement new efficiencies, and, as always, remaining vigilant 24/7 worldwide.
(U//FOUO) The pressure to maintain the world's premier intelligence enterprise in the face of shrinking
budgets will be difficult. We will accept and manage risk, more so than we've had to in the last decade.
(U//FOUO) This NIP budget proposed is balanced and executable. It does not reflect the potential for a
sequester in January 2013. Instead, the FY 2013 President's Budget proposes savings in other areas that exceed
the Joint Committee threshold, and as a result seeks to cancel the automatic reductions and restore the caps to
the original definitions in the Budget Control Act.
(U) Intelligence is the first line of defense. This budget provides the programs and initiatives vital to our
national security. Our partnership with you — our Congressional oversight committees — is critical to our
collective success. With your continued support, the IC can continue to fulfill our mission to keep America and
its interests secure.
James Clapper
TOP SECRET//SI/TK//NOFORN
5
TOP SECRET//SI/TK//NOFORN
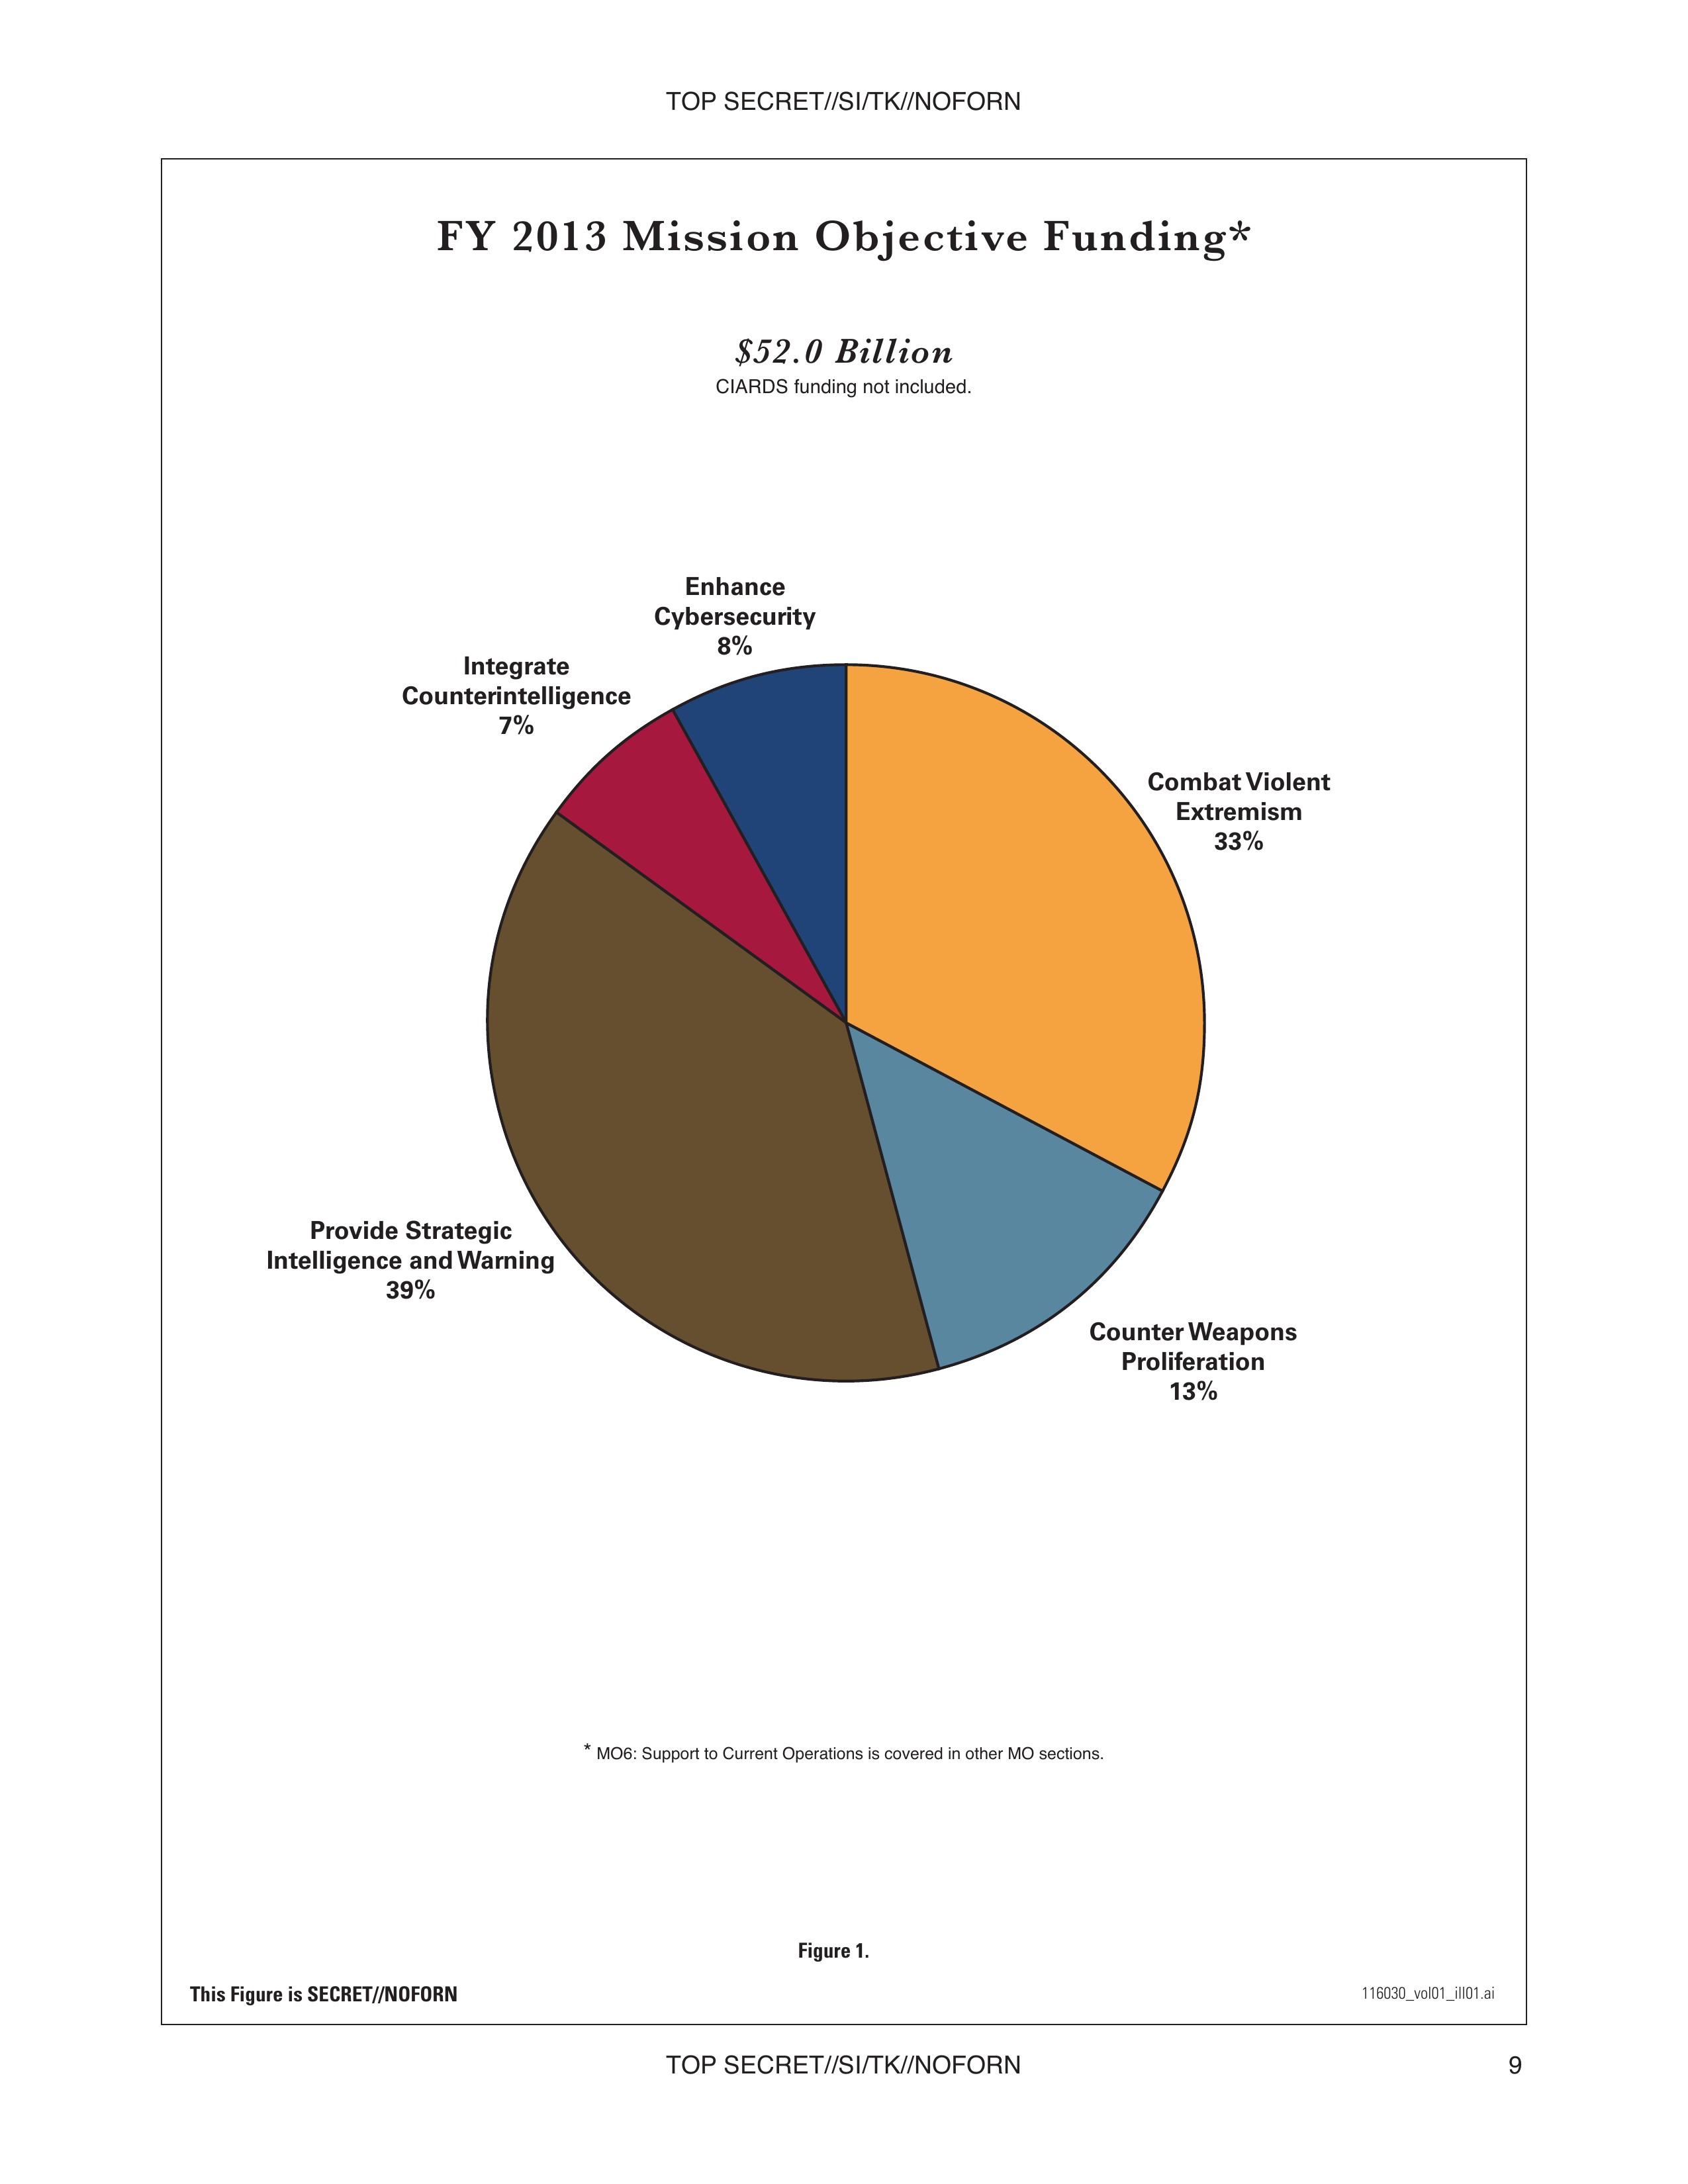
FY 2013 Mission Objective Funding*
$52.0 Billion
CIARDS funding not included.
- Combat Violent Extremism 33%
- Counter Weapons Proliferation 13%
- Provide Strategic Intelligence and Warning 39%
- Integrate Counterintelligence 7%
- Enhance Cybersecurity 8%
* MO6: Support to Current Operations is covered in other MO sections.
Figure 1.
This Figure is SECRET//NOFORN
116030_vol01_ill01.ai
TOP SECRET//SI/TK//NOFORN
9
TOP SECRET//SI/TK//NOFORN
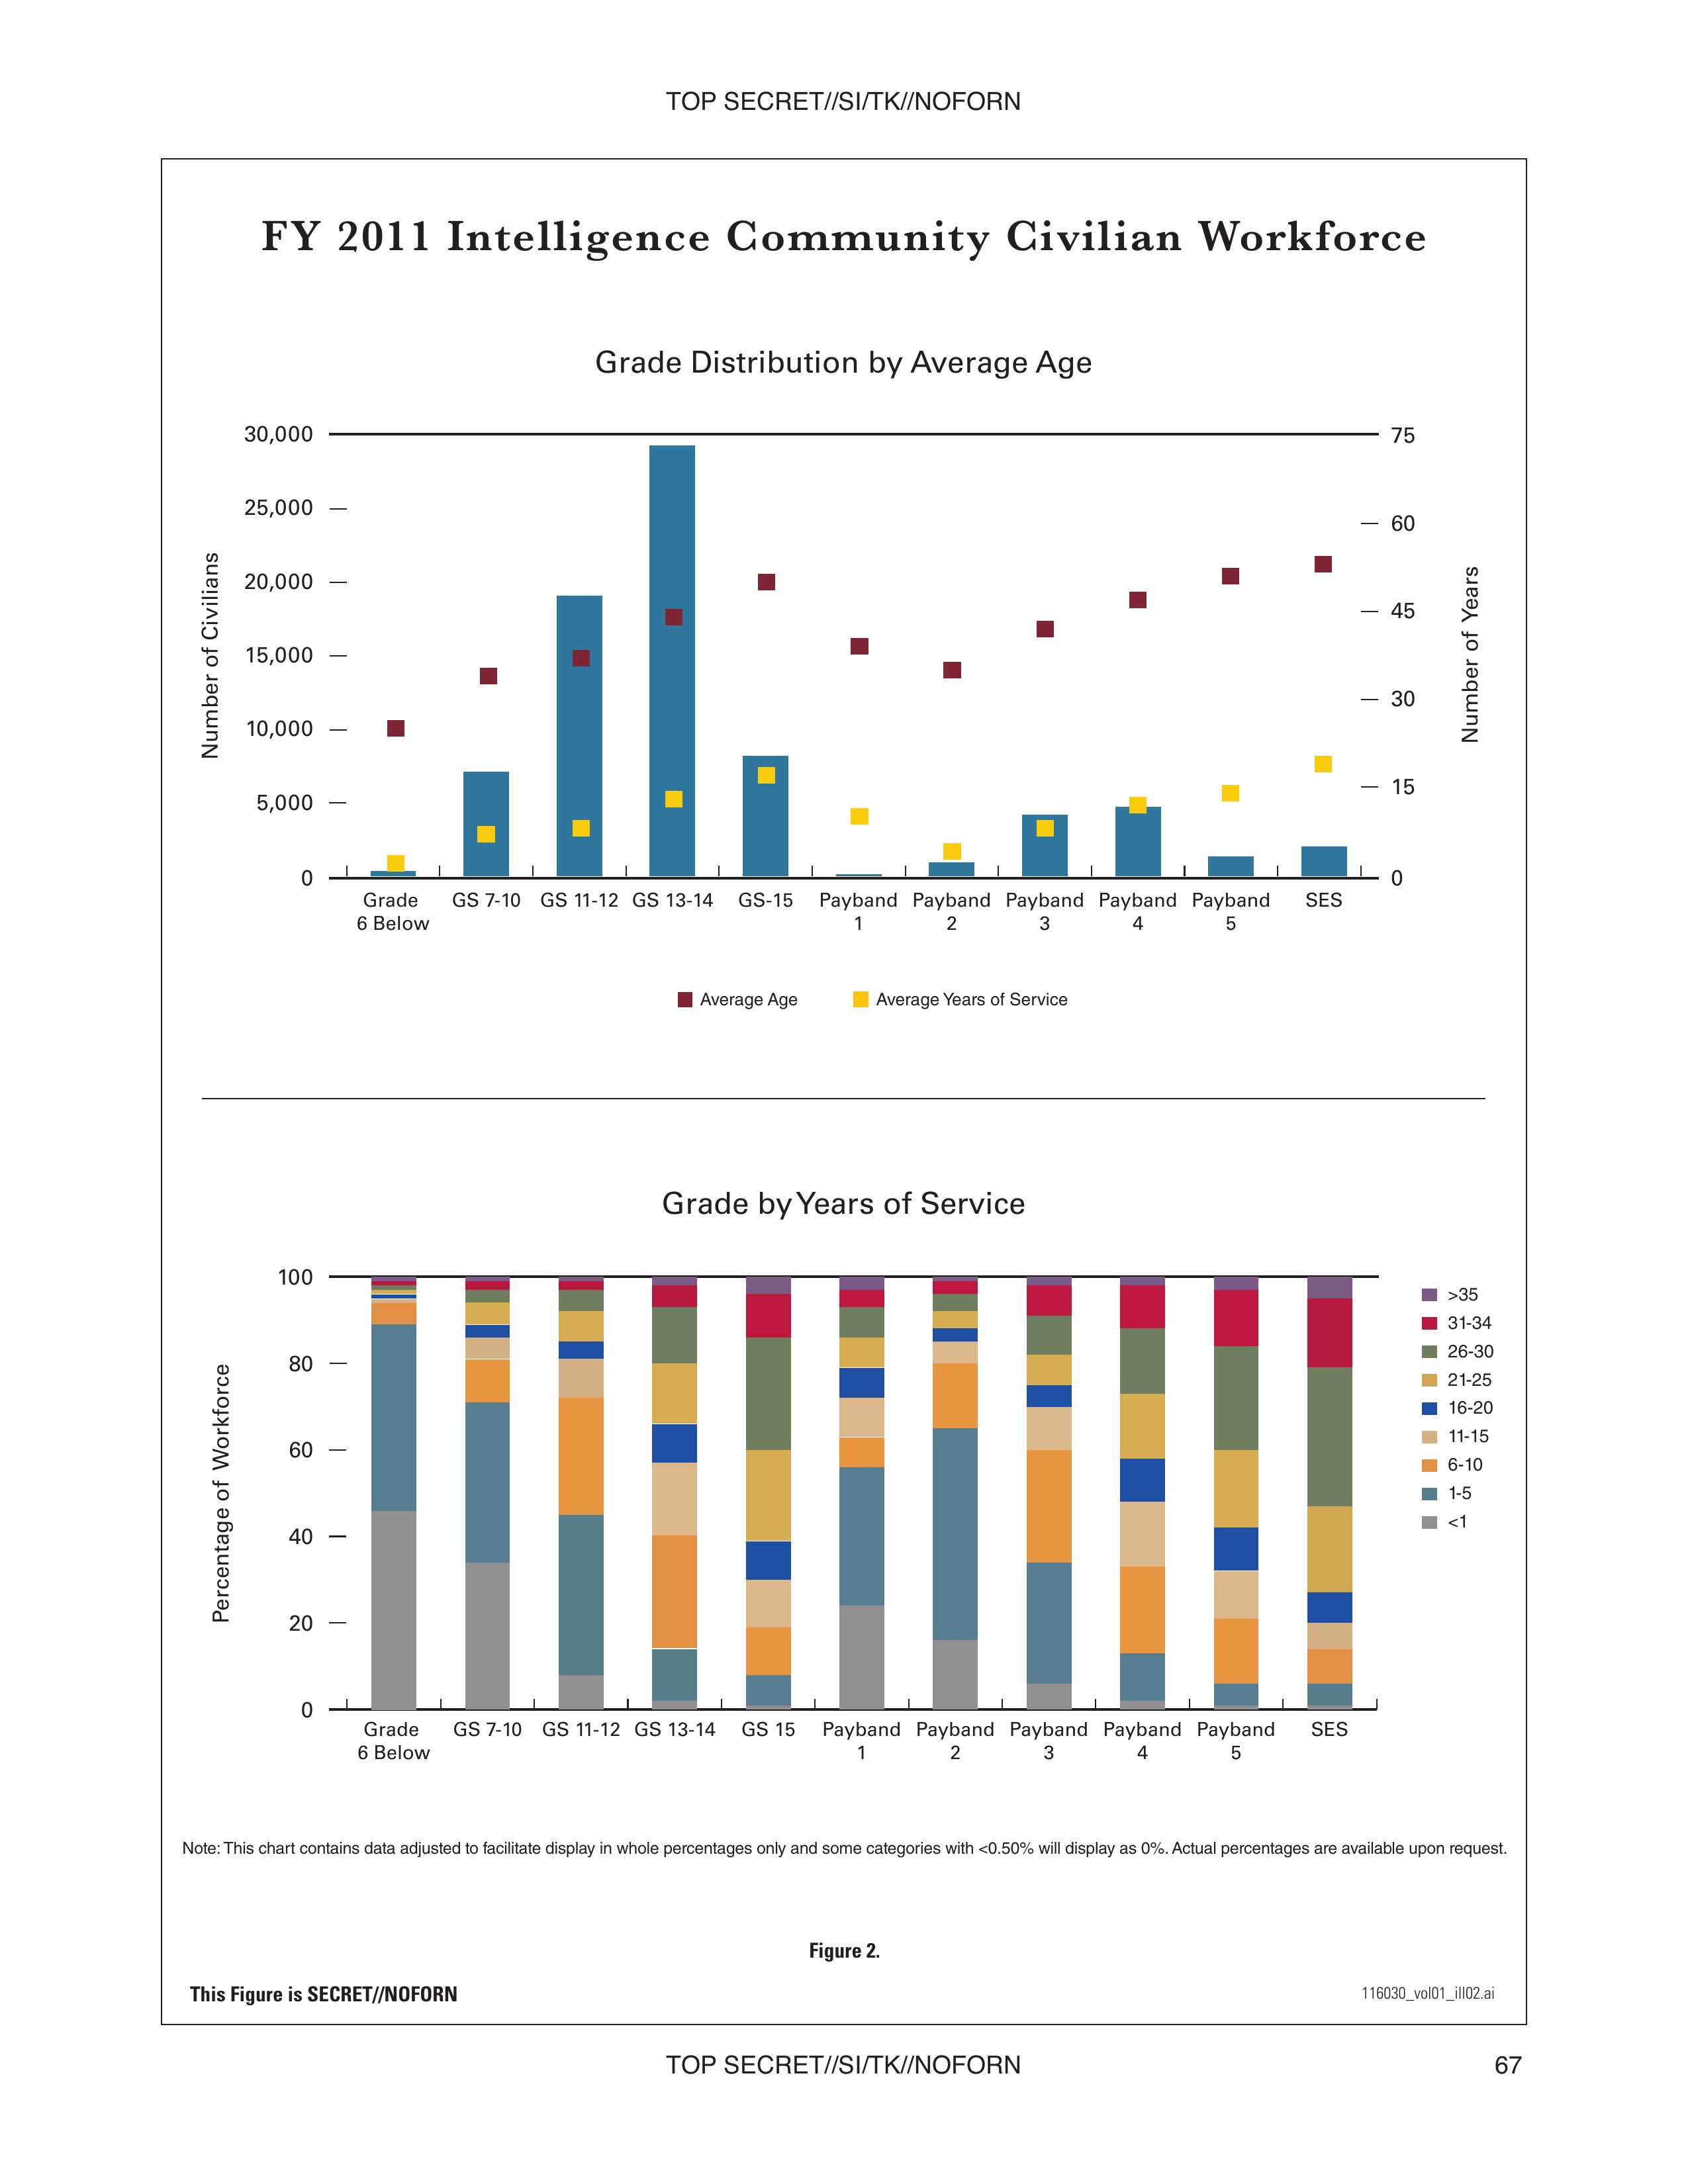
FY 2011 Intelligence Community Civilian Workforce
Grade Distribution by Average Age
| Grade Category | Number of Civilians | Average Age (Years) | Average Years of Service |
|---|---|---|---|
| Grade 6 Below | ~500 | ~26 | ~1 |
| GS 7–10 | ~7,000 | ~35 | ~6 |
| GS 11–12 | ~18,000 | ~40 | ~8 |
| GS 13–14 | ~29,000 | ~44 | ~14 |
| GS 15 | ~8,000 | ~50 | ~17 |
| Payband 1 | ~200 | ~37 | ~12 |
| Payband 2 | ~1,500 | ~35 | ~5 |
| Payband 3 | ~4,800 | ~40 | ~7 |
| Payband 4 | ~4,900 | ~47 | ~10 |
| Payband 5 | ~2,000 | ~51 | ~15 |
| SES | ~2,500 | ~54 | ~20 |
- Average Age
- Average Years of Service
Grade by Years of Service
Percentage of Workforce
| Grade Category | <1 | 1–5 | 6–10 | 11–15 | 16–20 | 21–25 | 26–30 | 31–34 | >35 |
|---|---|---|---|---|---|---|---|---|---|
| Grade 6 Below | 43 | 43 | 5 | 2 | 1 | 1 | 0.5 | 0.5 | 1 |
| GS 7–10 | 37 | 36 | 10 | 5 | 2 | 1.5 | 1 | 0.5 | 1 |
| GS 11–12 | 7 | 35 | 28 | 10 | 5 | 5 | 5 | 3 | 1 |
| GS 13–14 | 2 | 10 | 21 | 15 | 10 | 10 | 7 | 5 | 3 |
| GS 15 | 1 | 7 | 10 | 15 | 10 | 10 | 10 | 8 | 6 |
| Payband 1 | 22 | 30 | 8 | 10 | 5 | 5 | 3 | 1.5 | 3 |
| Payband 2 | 17 | 50 | 16 | 10 | 7 | 7 | 3 | 2 | 1 |
| Payband 3 | 8 | 28 | 25 | 15 | 10 | 8 | 5 | 2 | 2 |
| Payband 4 | 3 | 16 | 20 | 15 | 10 | 10 | 8 | 5 | 2 |
| Payband 5 | 1 | 8 | 13 | 15 | 10 | 10 | 10 | 5 | 4 |
| SES | 1 | 8 | 8 | 8 | 10 | 20 | 43 | 12 | 5 |
Note: This chart contains data adjusted to facilitate display in whole percentages only and some categories with <0.50% will display as 0%. Actual percentages are available upon request.
Figure 2.
This Figure is SECRET//NOFORN
116030_vol01_ill02.ai
TOP SECRET//SI/TK//NOFORN
67
TOP SECRET//SI/TK//NOFORN
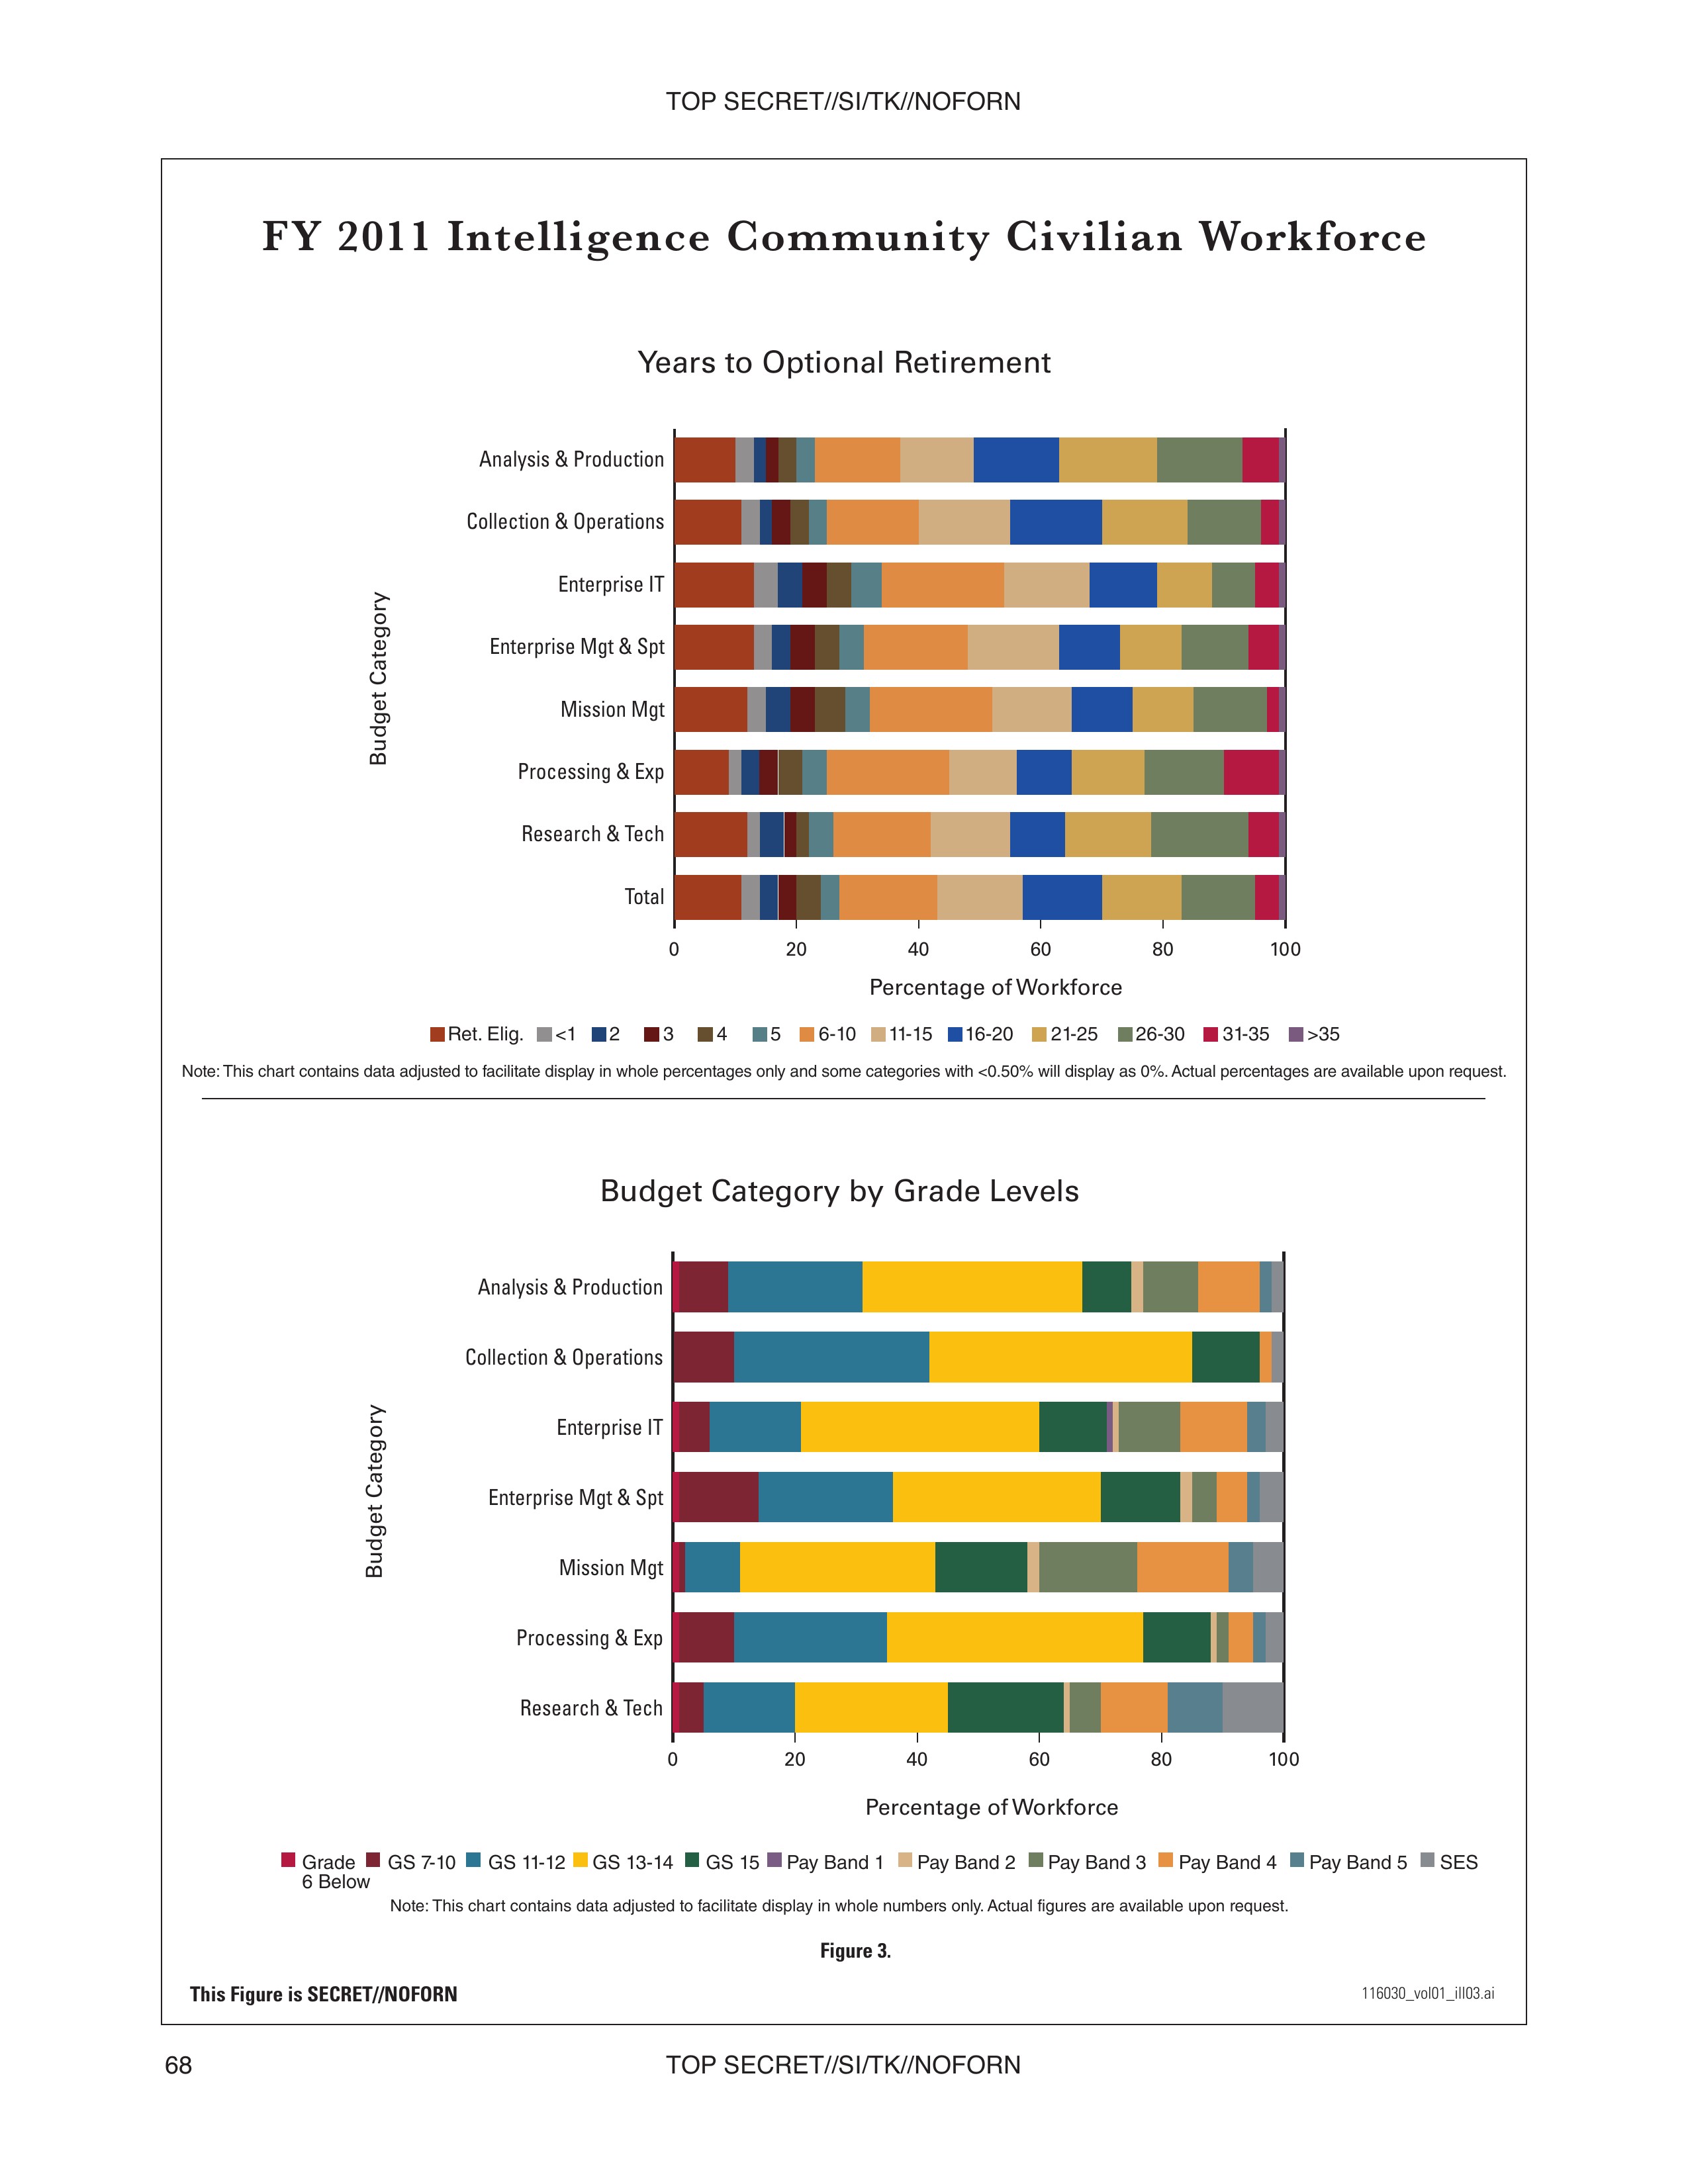
FY 2011 Intelligence Community Civilian Workforce
Years to Optional Retirement
Budget Category

Analysis & Production
Collection & Operations
Enterprise IT
Enterprise Mgt & Spt
Mission Mgt
Processing & Exp
Research & Tech
Total
0 20 40 60 80 100
Note: This chart contains data adjusted to facilitate display in whole percentages only and some categories with <0.50% will display as 0%. Actual percentages are available upon request.
Budget Category by Grade Levels
Budget Category

Analysis & Production
Collection & Operations
Enterprise IT
Enterprise Mgt & Spt
Mission Mgt
Processing & Exp
Research & Tech
Total
0 20 40 60 80 100
Note: This chart contains data adjusted to facilitate display in whole numbers only. Actual figures are available upon request.
Figure 3.
This Figure is SECRET//NOFORN
116030_vol01_ill03.ai
TOP SECRET//SI/TK//NOFORN
68
TOP SECRET//SI/TK//NOFORN
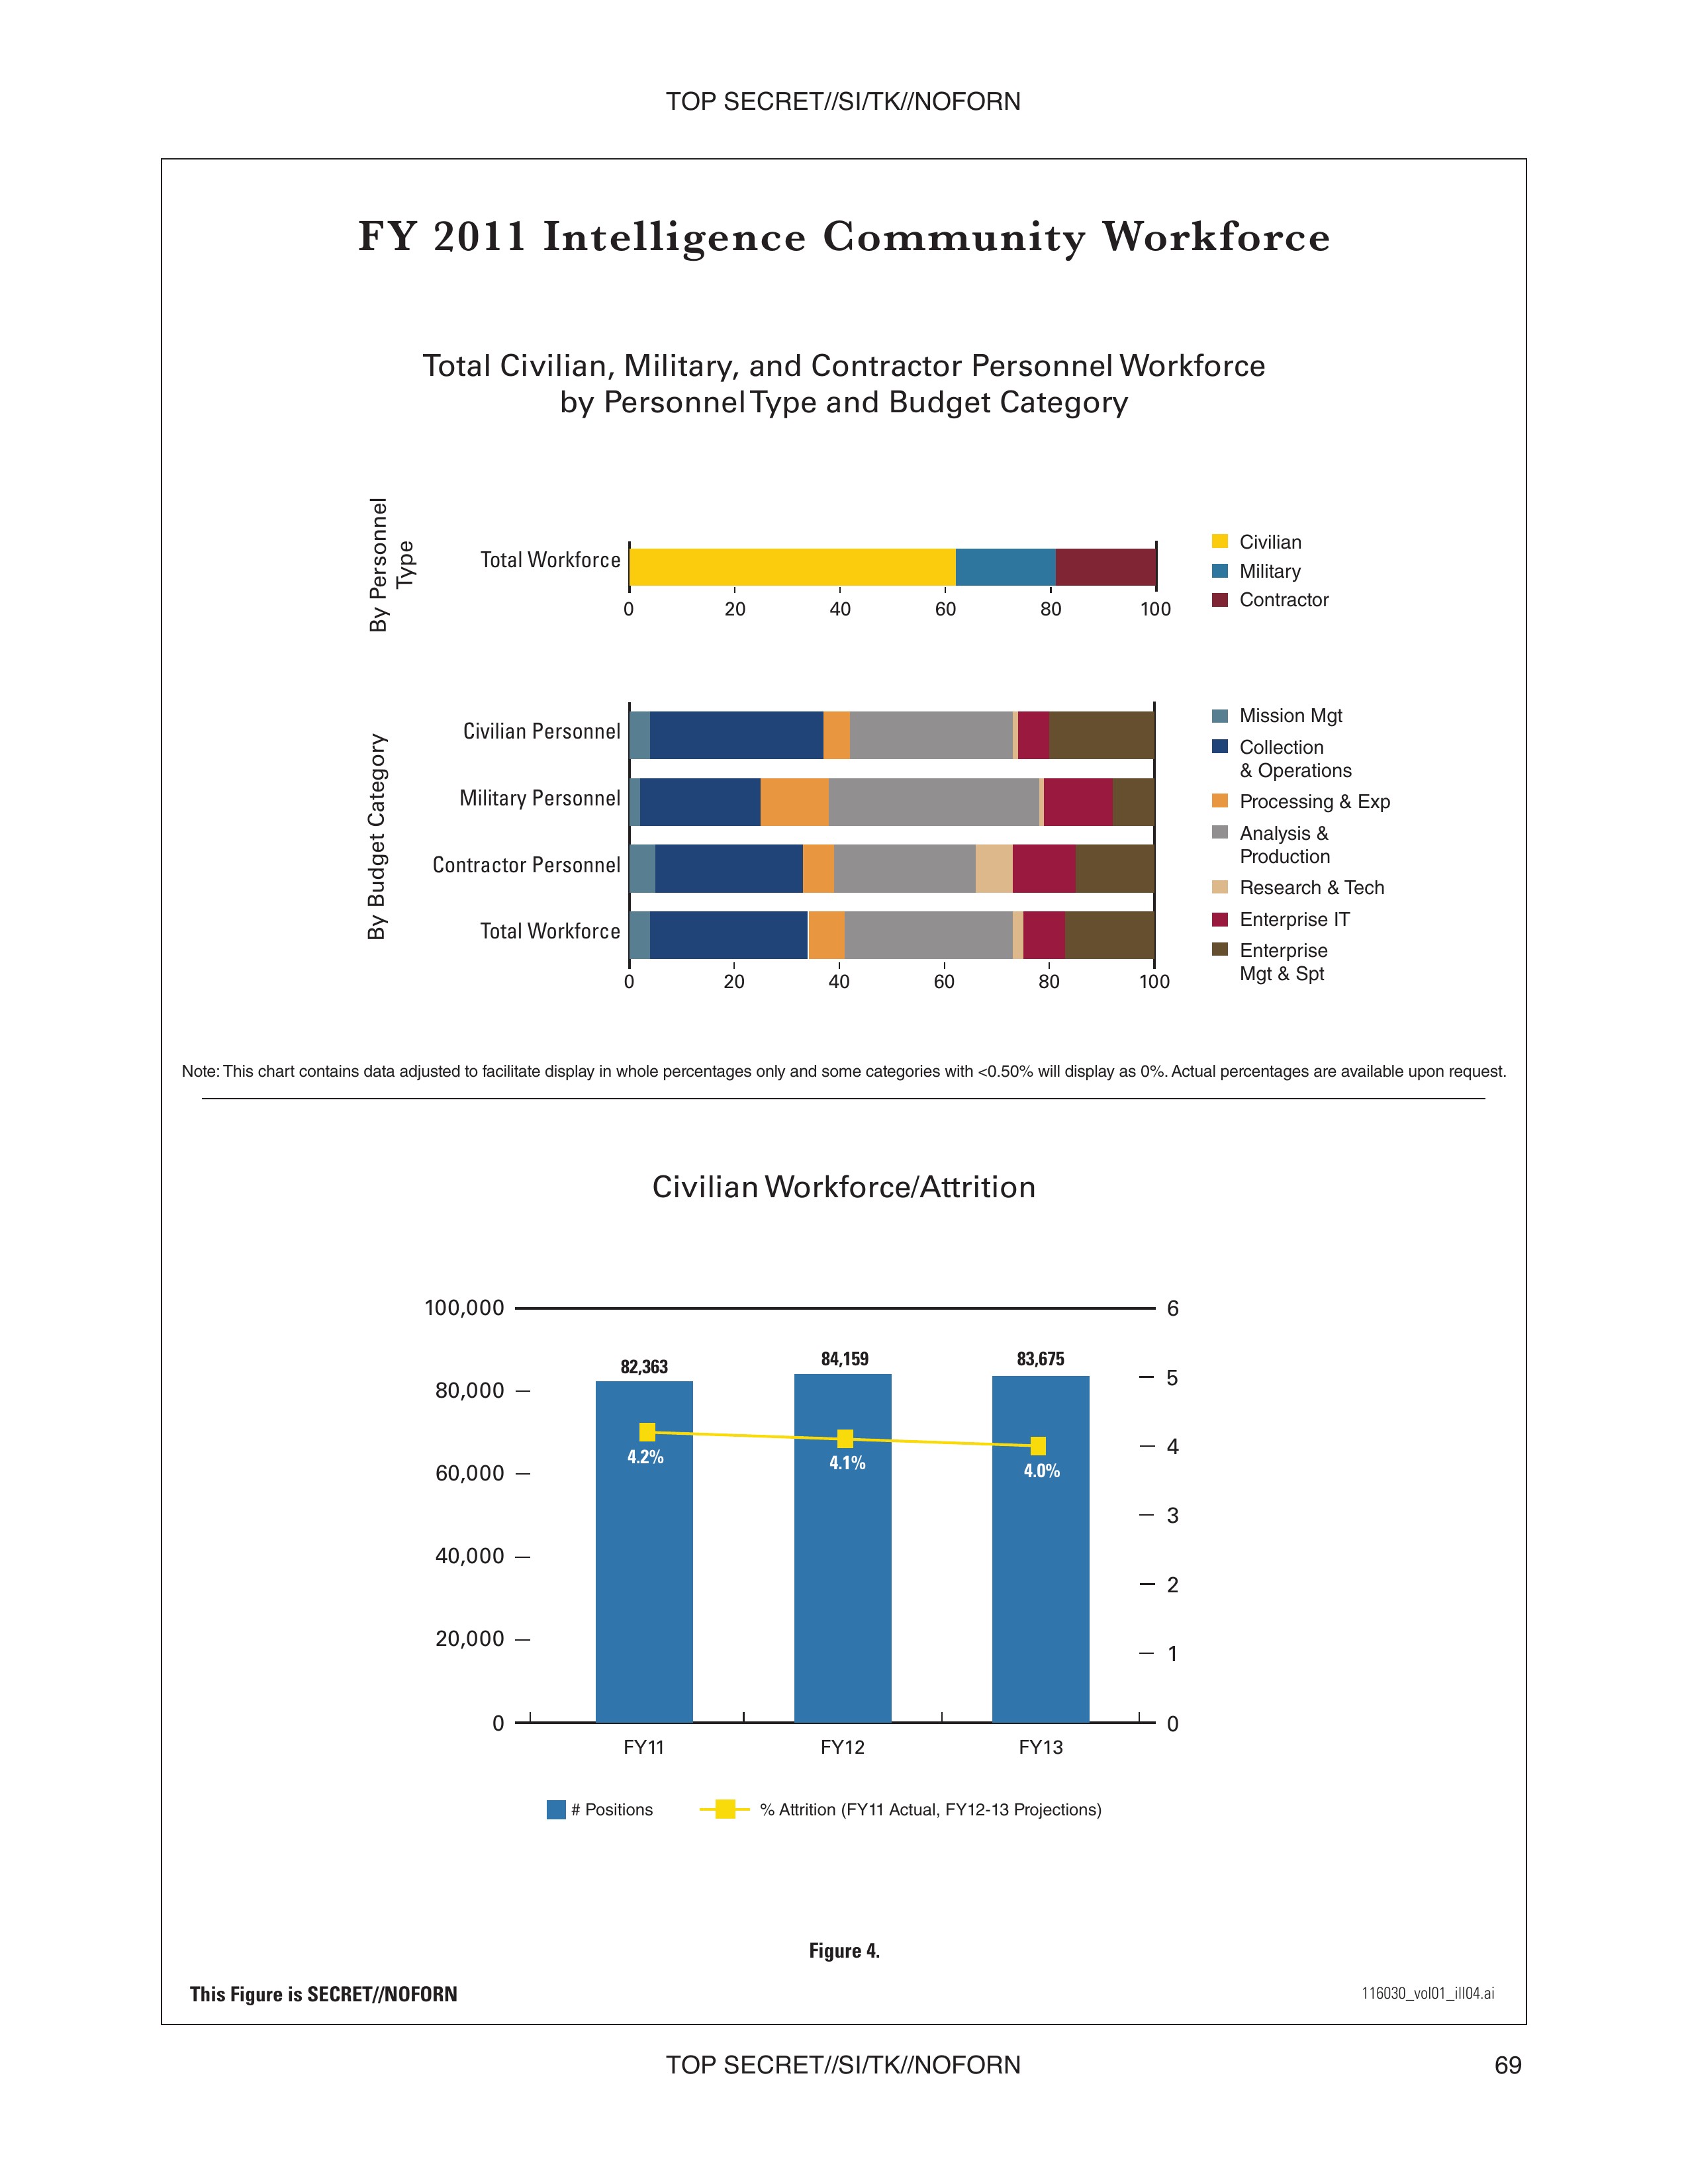
FY 2011 Intelligence Community Workforce
Total Civilian, Military, and Contractor Personnel Workforce by Personnel Type and Budget Category
By Personnel Type

Total Workforce
Civilian
Military
Contractor
0 20 40 60 80 100
By Budget Category

Mission Mgt
Collection & Operations
Processing & Exp
Analysis & Production
Research & Tech
Enterprise IT
Enterprise Mgt & Spt

Civilian Personnel
Military Personnel
Contractor Personnel
Total Workforce
Note: This chart contains data adjusted to facilitate display in whole percentages only and some categories with <0.50% will display as 0%. Actual percentages are available upon request.
Civilian Workforce/Attrition

100,000
80,000
60,000
40,000
20,000
0
FY11 FY12 FY13
82,363 4.2% 84,159 4.1% 83,675 4.0%
6
5
4
3
2
1
0
# Positions % Attrition (FY11 Actual, FY12-13 Projections)
Figure 4.
This Figure is SECRET//NOFORN
116030_vol01_ill04.ai
TOP SECRET//SI/TK//NOFORN
69
TOP SECRET//SI/TK//NOFORN
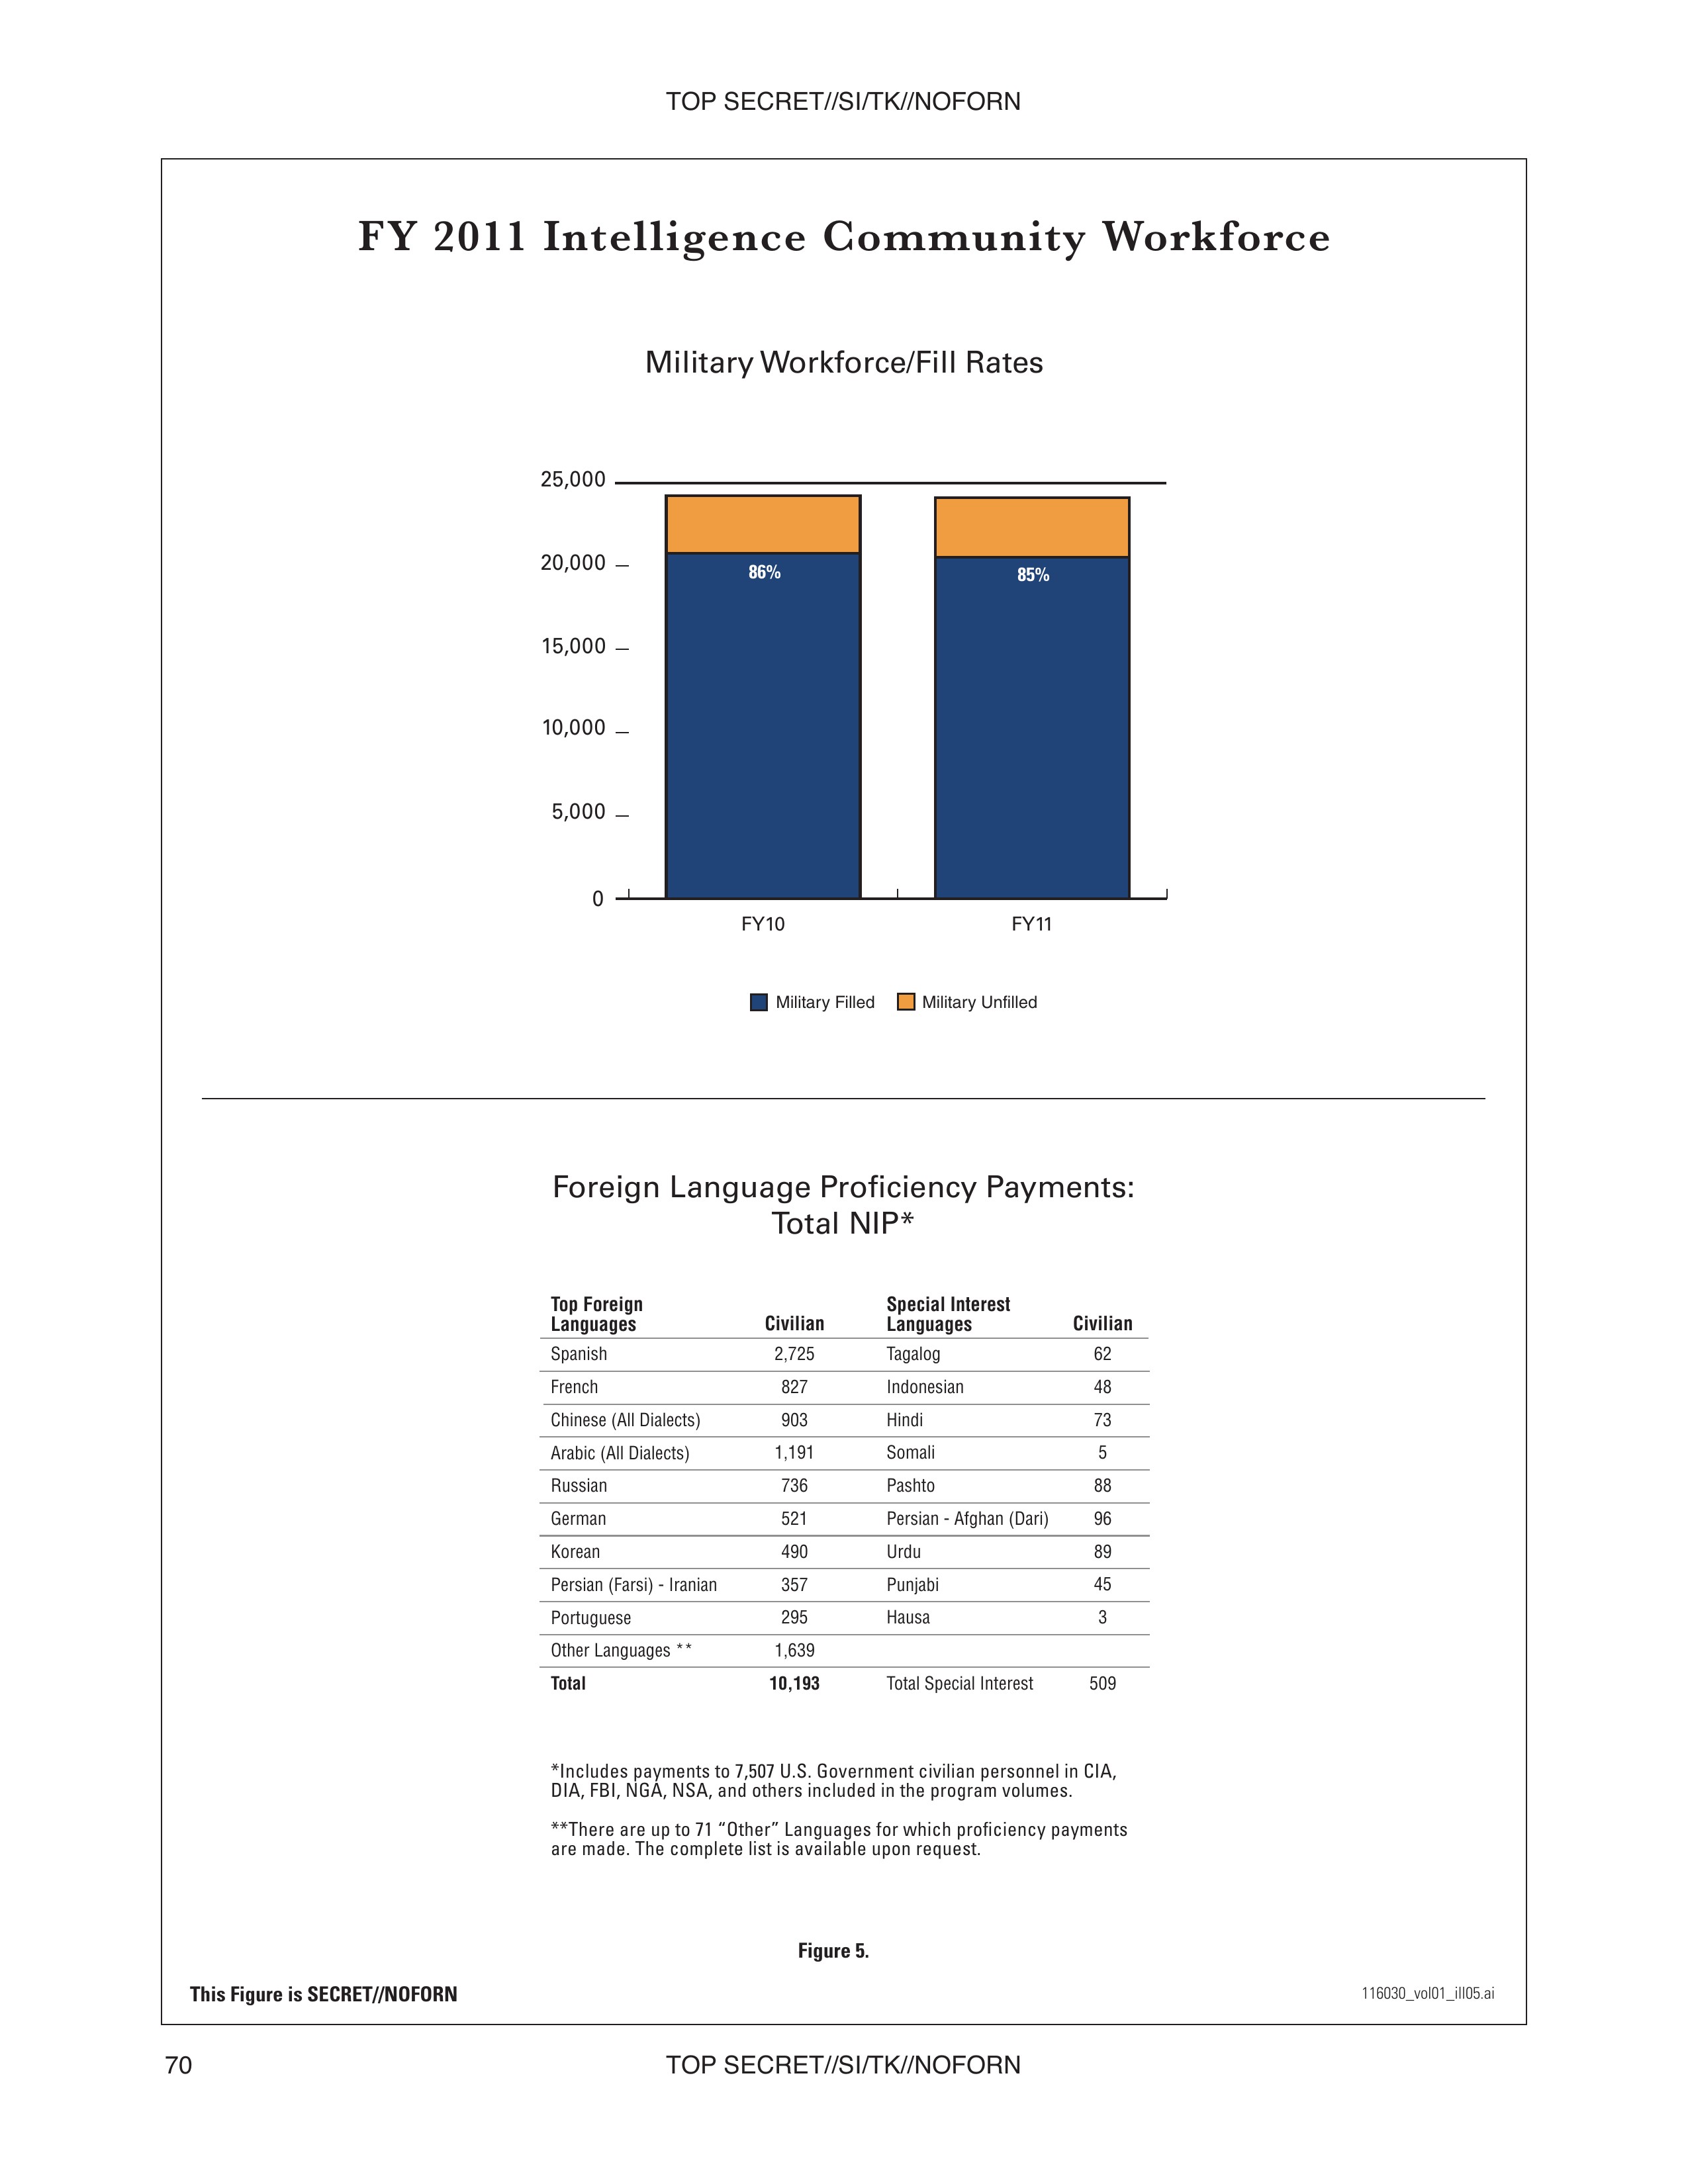
FY 2011 Intelligence Community Workforce
Military Workforce/Fill Rates

25,000
20,000
15,000
10,000
5,000
0
FY10 FY11
86% 85%
Military Filled Military Unfilled
Foreign Language Proficiency Payments: Total NIP*

Top Foreign Languages
Civilian
Special Interest Languages
Civilian

Spanish 2,725 Tagalog 62
French 827 Indonesian 48
Chinese (All Dialects) 903 Hindi 73
Arabic (All Dialects) 1,191 Somali 5
Russian 736 Pashto 88
German 521 Persian - Afghan (Dari) 96
Korean 490 Urdu 89
Persian (Farsi) - Iranian 357 Punjabi 45
Portuguese 295 Hausa 3
Other Languages ** 1,639
Total 10,193 Total Special Interest 509

*Includes payments to 7,507 U.S. Government civilian personnel in CIA,
DIA, FBI, NGA, NSA, and others included in the program volumes.

**There are up to 71 "Other" Languages for which proficiency payments
are made. The complete list is available upon request.
Figure 5.
This Figure is SECRET//NOFORN
116030_vol01_ill05.ai
TOP SECRET//SI/TK//NOFORN
70
TOP SECRET//SI/TK//NOFORN
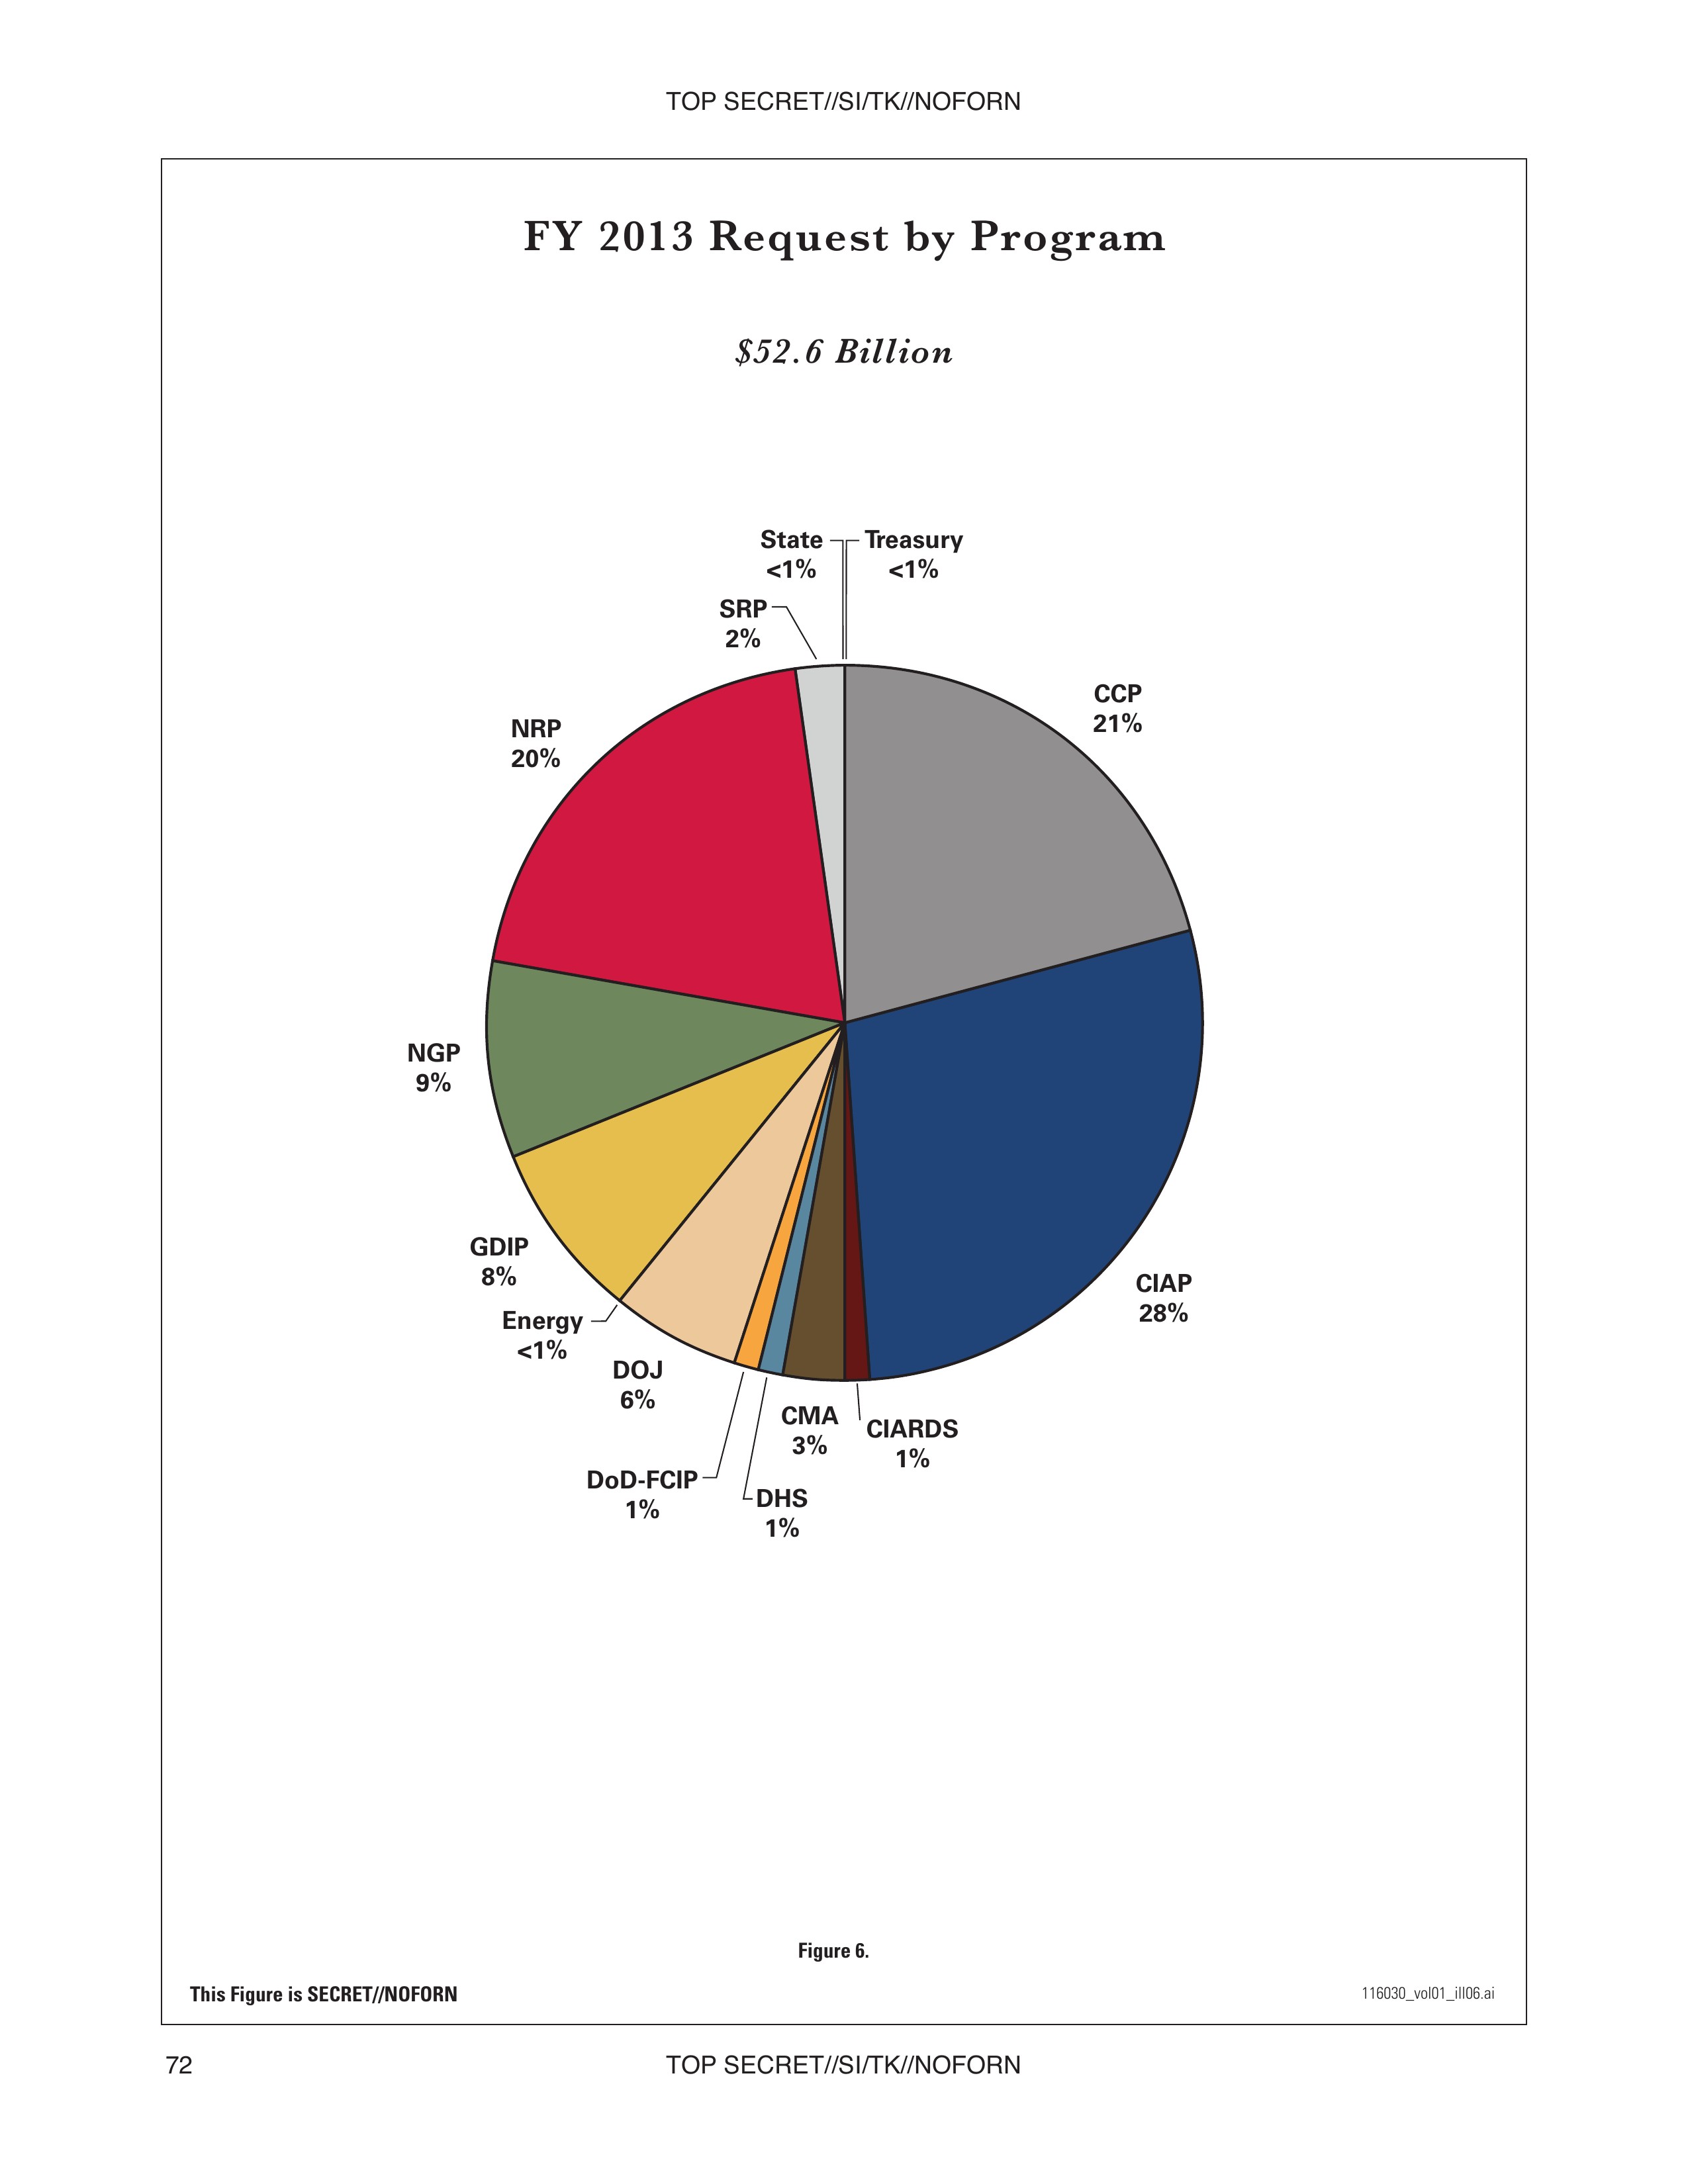
FY 2013 Request by Program
$52.6 Billion
CCP 21%
CIAP 28%
CIARDS 1%
CMA 3%
DoD-FCIP 1%
DHS 1%
DOJ 6%
Energy <1%
GDIP 8%
NGP 9%
NRP 20%
SRP 2%
State <1%
Treasury <1%
Figure 6.
116030_vol01_ill06.ai
This Figure is SECRET//NOFORN
TOP SECRET//SI/TK//NOFORN
72
TOP SECRET//SI/TK//NOFORN
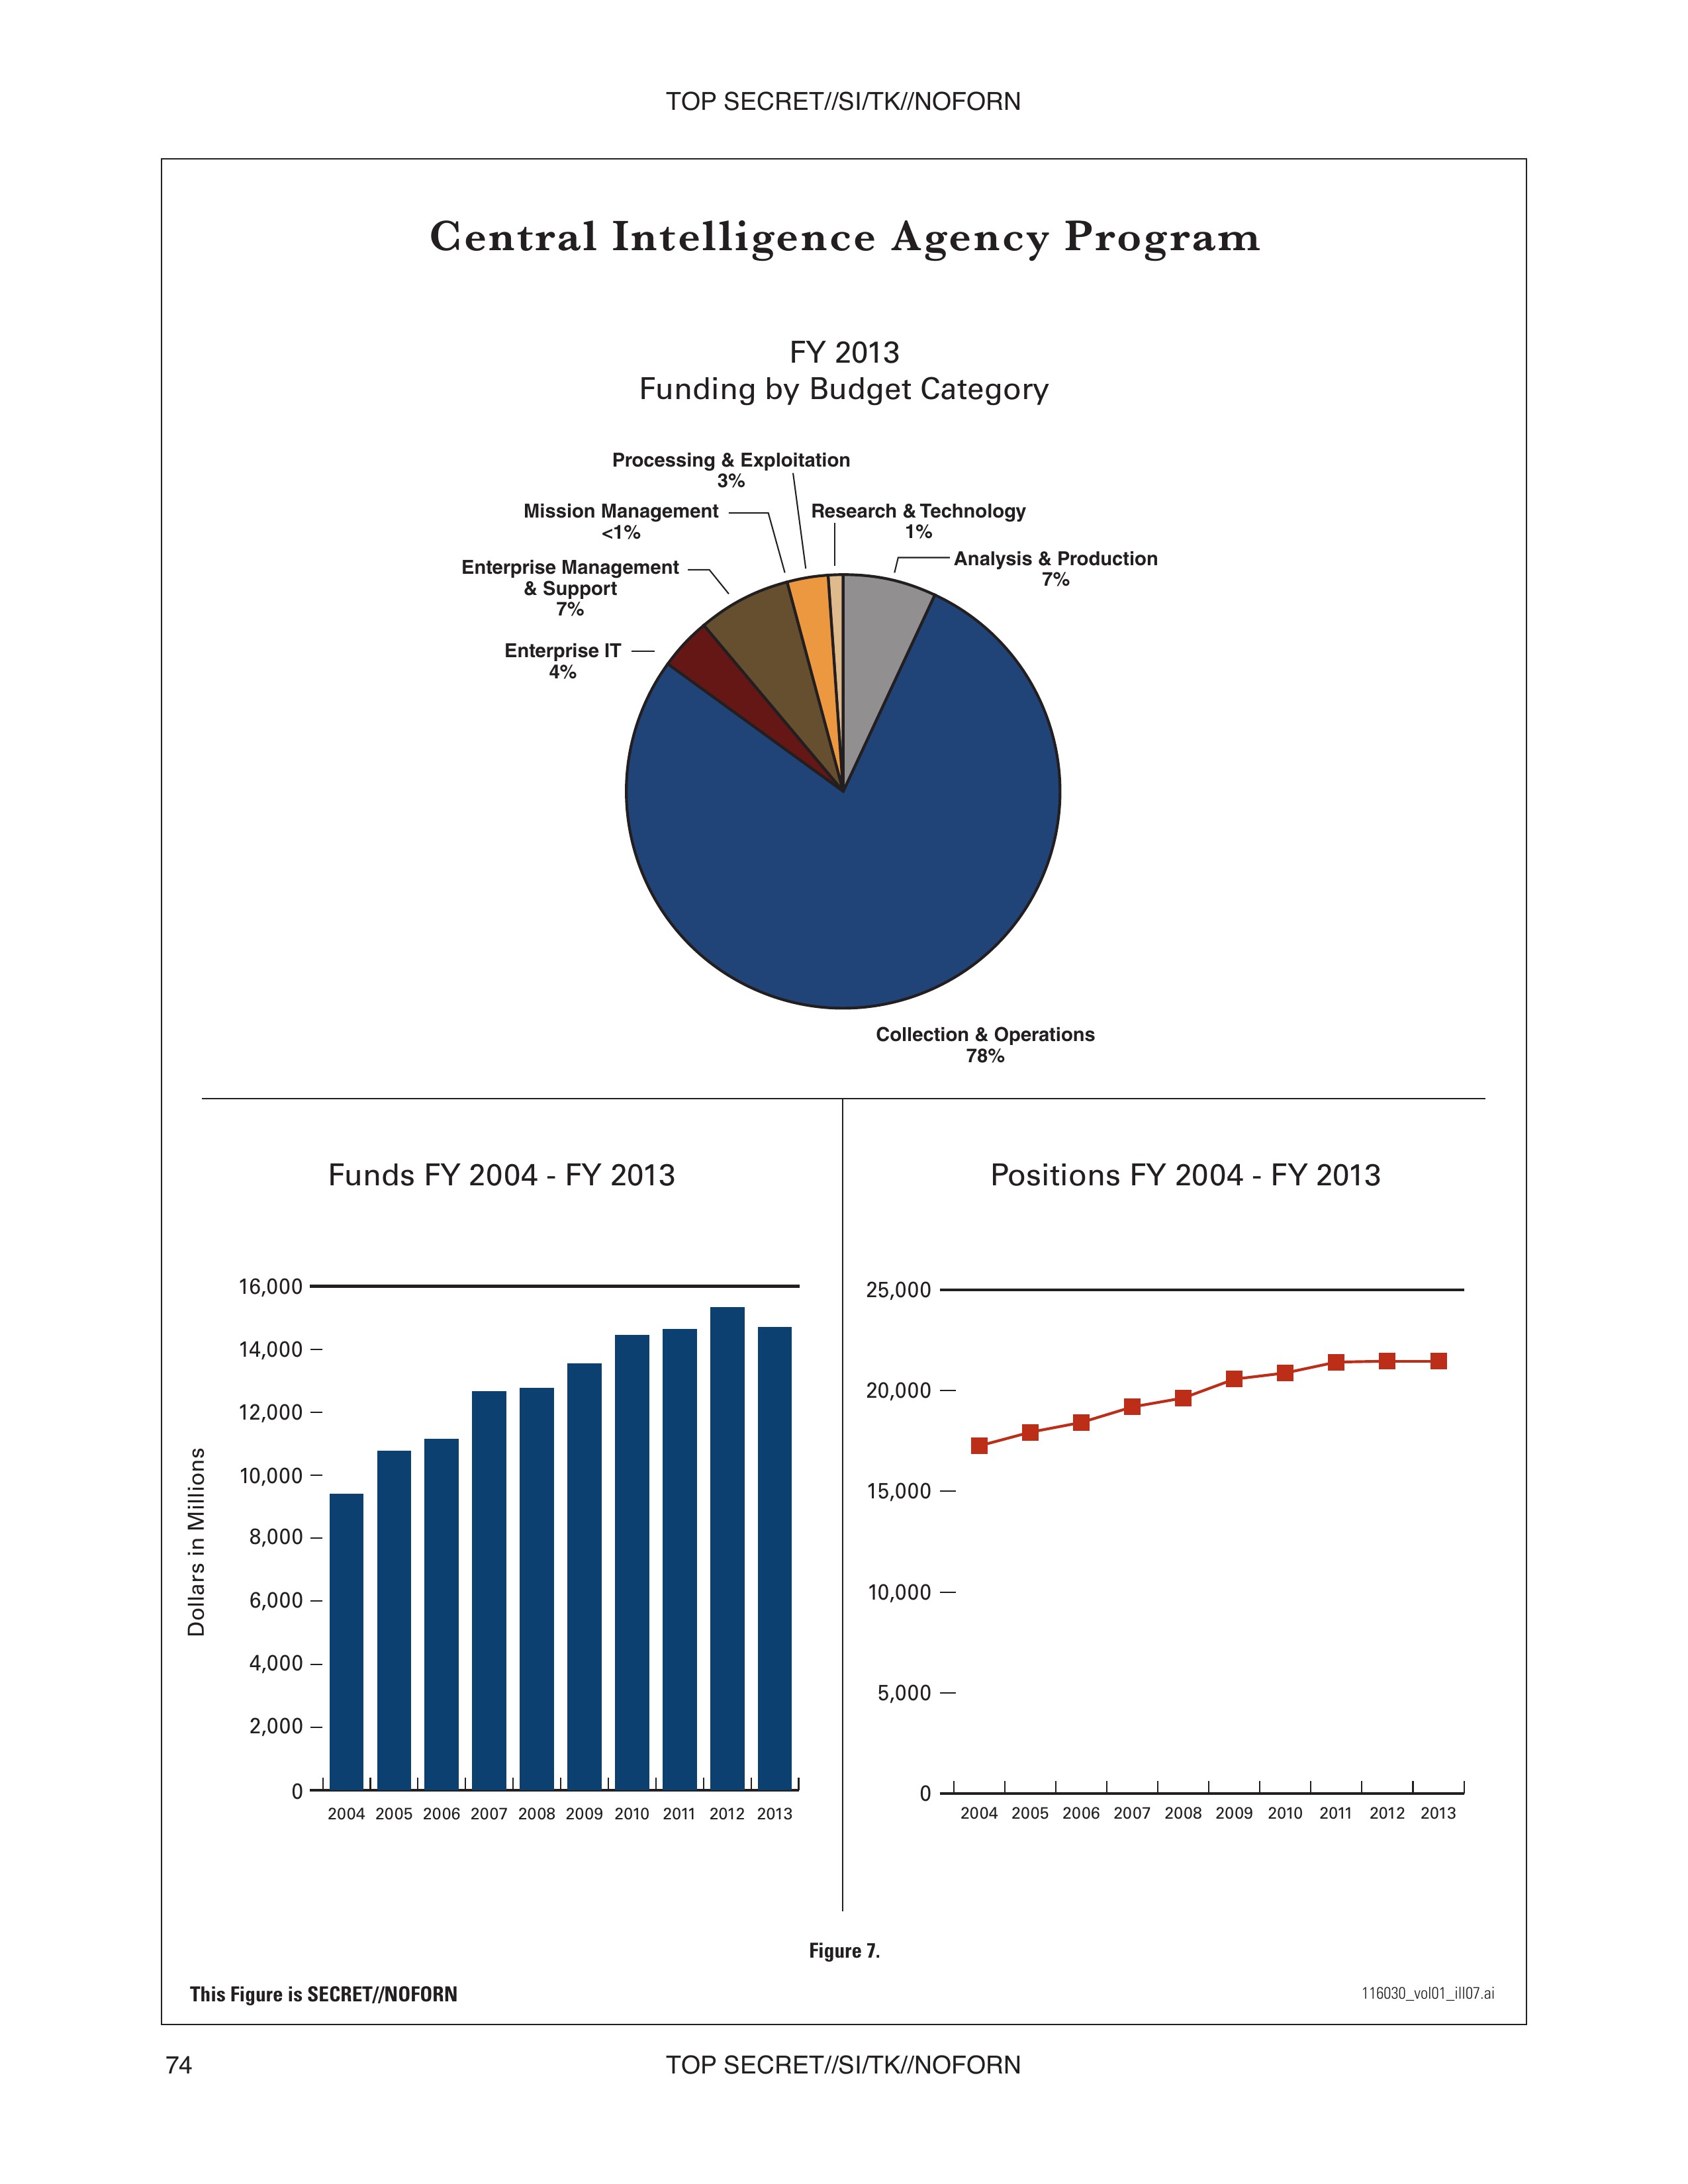
Central Intelligence Agency Program
FY 2013
Funding by Budget Category

Collection & Operations 78%
Analysis & Production 7%
Research & Technology 1%
Processing & Exploitation 3%
Mission Management <1%
Enterprise Management & Support 7%
Enterprise IT 4%
Funds FY 2004 - FY 2013

Dollars in Millions

16,000
14,000
12,000
10,000
8,000
6,000
4,000
2,000
0
2004 2005 2006 2007 2008 2009 2010 2011 2012 2013
Positions FY 2004 - FY 2013

25,000
20,000
15,000
10,000
5,000
0
2004 2005 2006 2007 2008 2009 2010 2011 2012 2013
Figure 7.
This Figure is SECRET//NOFORN
116030_vol01_ill07.ai
TOP SECRET//SI/TK//NOFORN
74
TOP SECRET//SI/TK//NOFORN
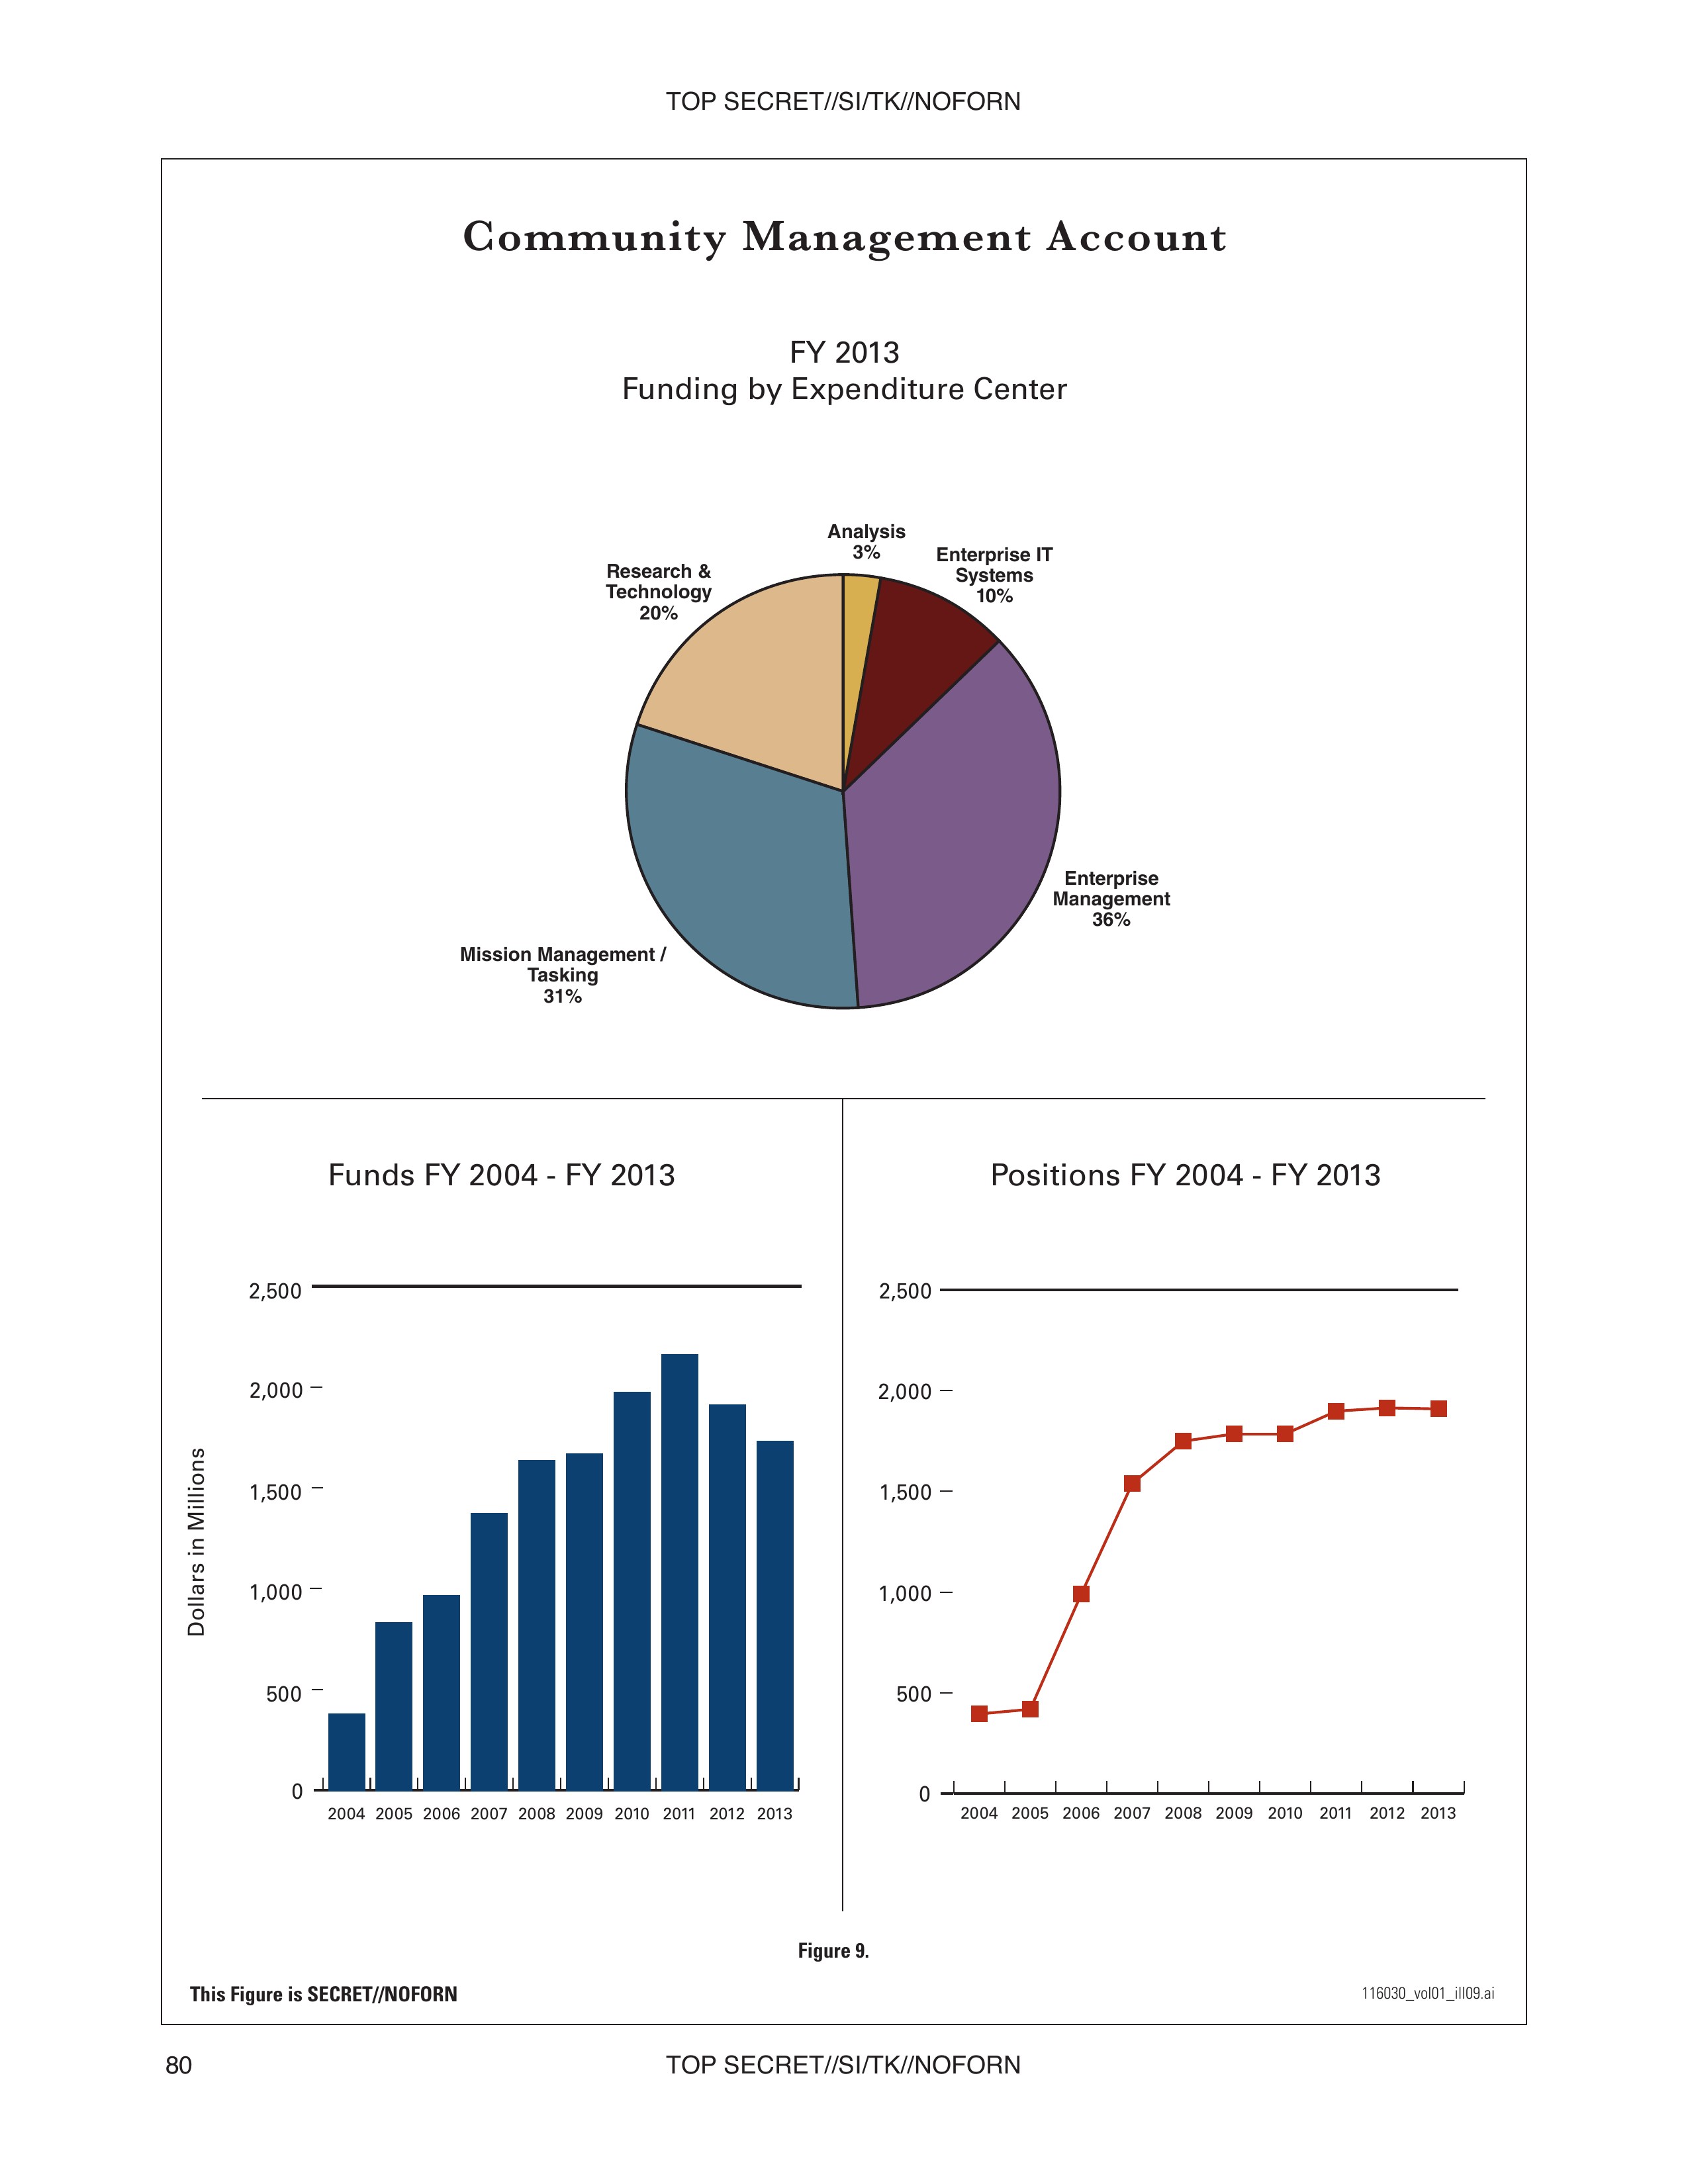
Community Management Account
FY 2013

Funding by Expenditure Center

Enterprise Management 36%
Enterprise IT Systems 10%
Analysis 3%
Research & Technology 20%
Mission Management / Tasking 31%
Funds FY 2004 - FY 2013

Dollars in Millions
2,500
2,000
1,500
1,000
500
0
2004 2005 2006 2007 2008 2009 2010 2011 2012 2013
Positions FY 2004 - FY 2013

2,500
2,000
1,500
1,000
500
0
2004 2005 2006 2007 2008 2009 2010 2011 2012 2013
Figure 9.
This Figure is SECRET//NOFORN
116030_vol01_ill09.ai
TOP SECRET//SI/TK//NOFORN
80
TOP SECRET//SI/TK//NOFORN
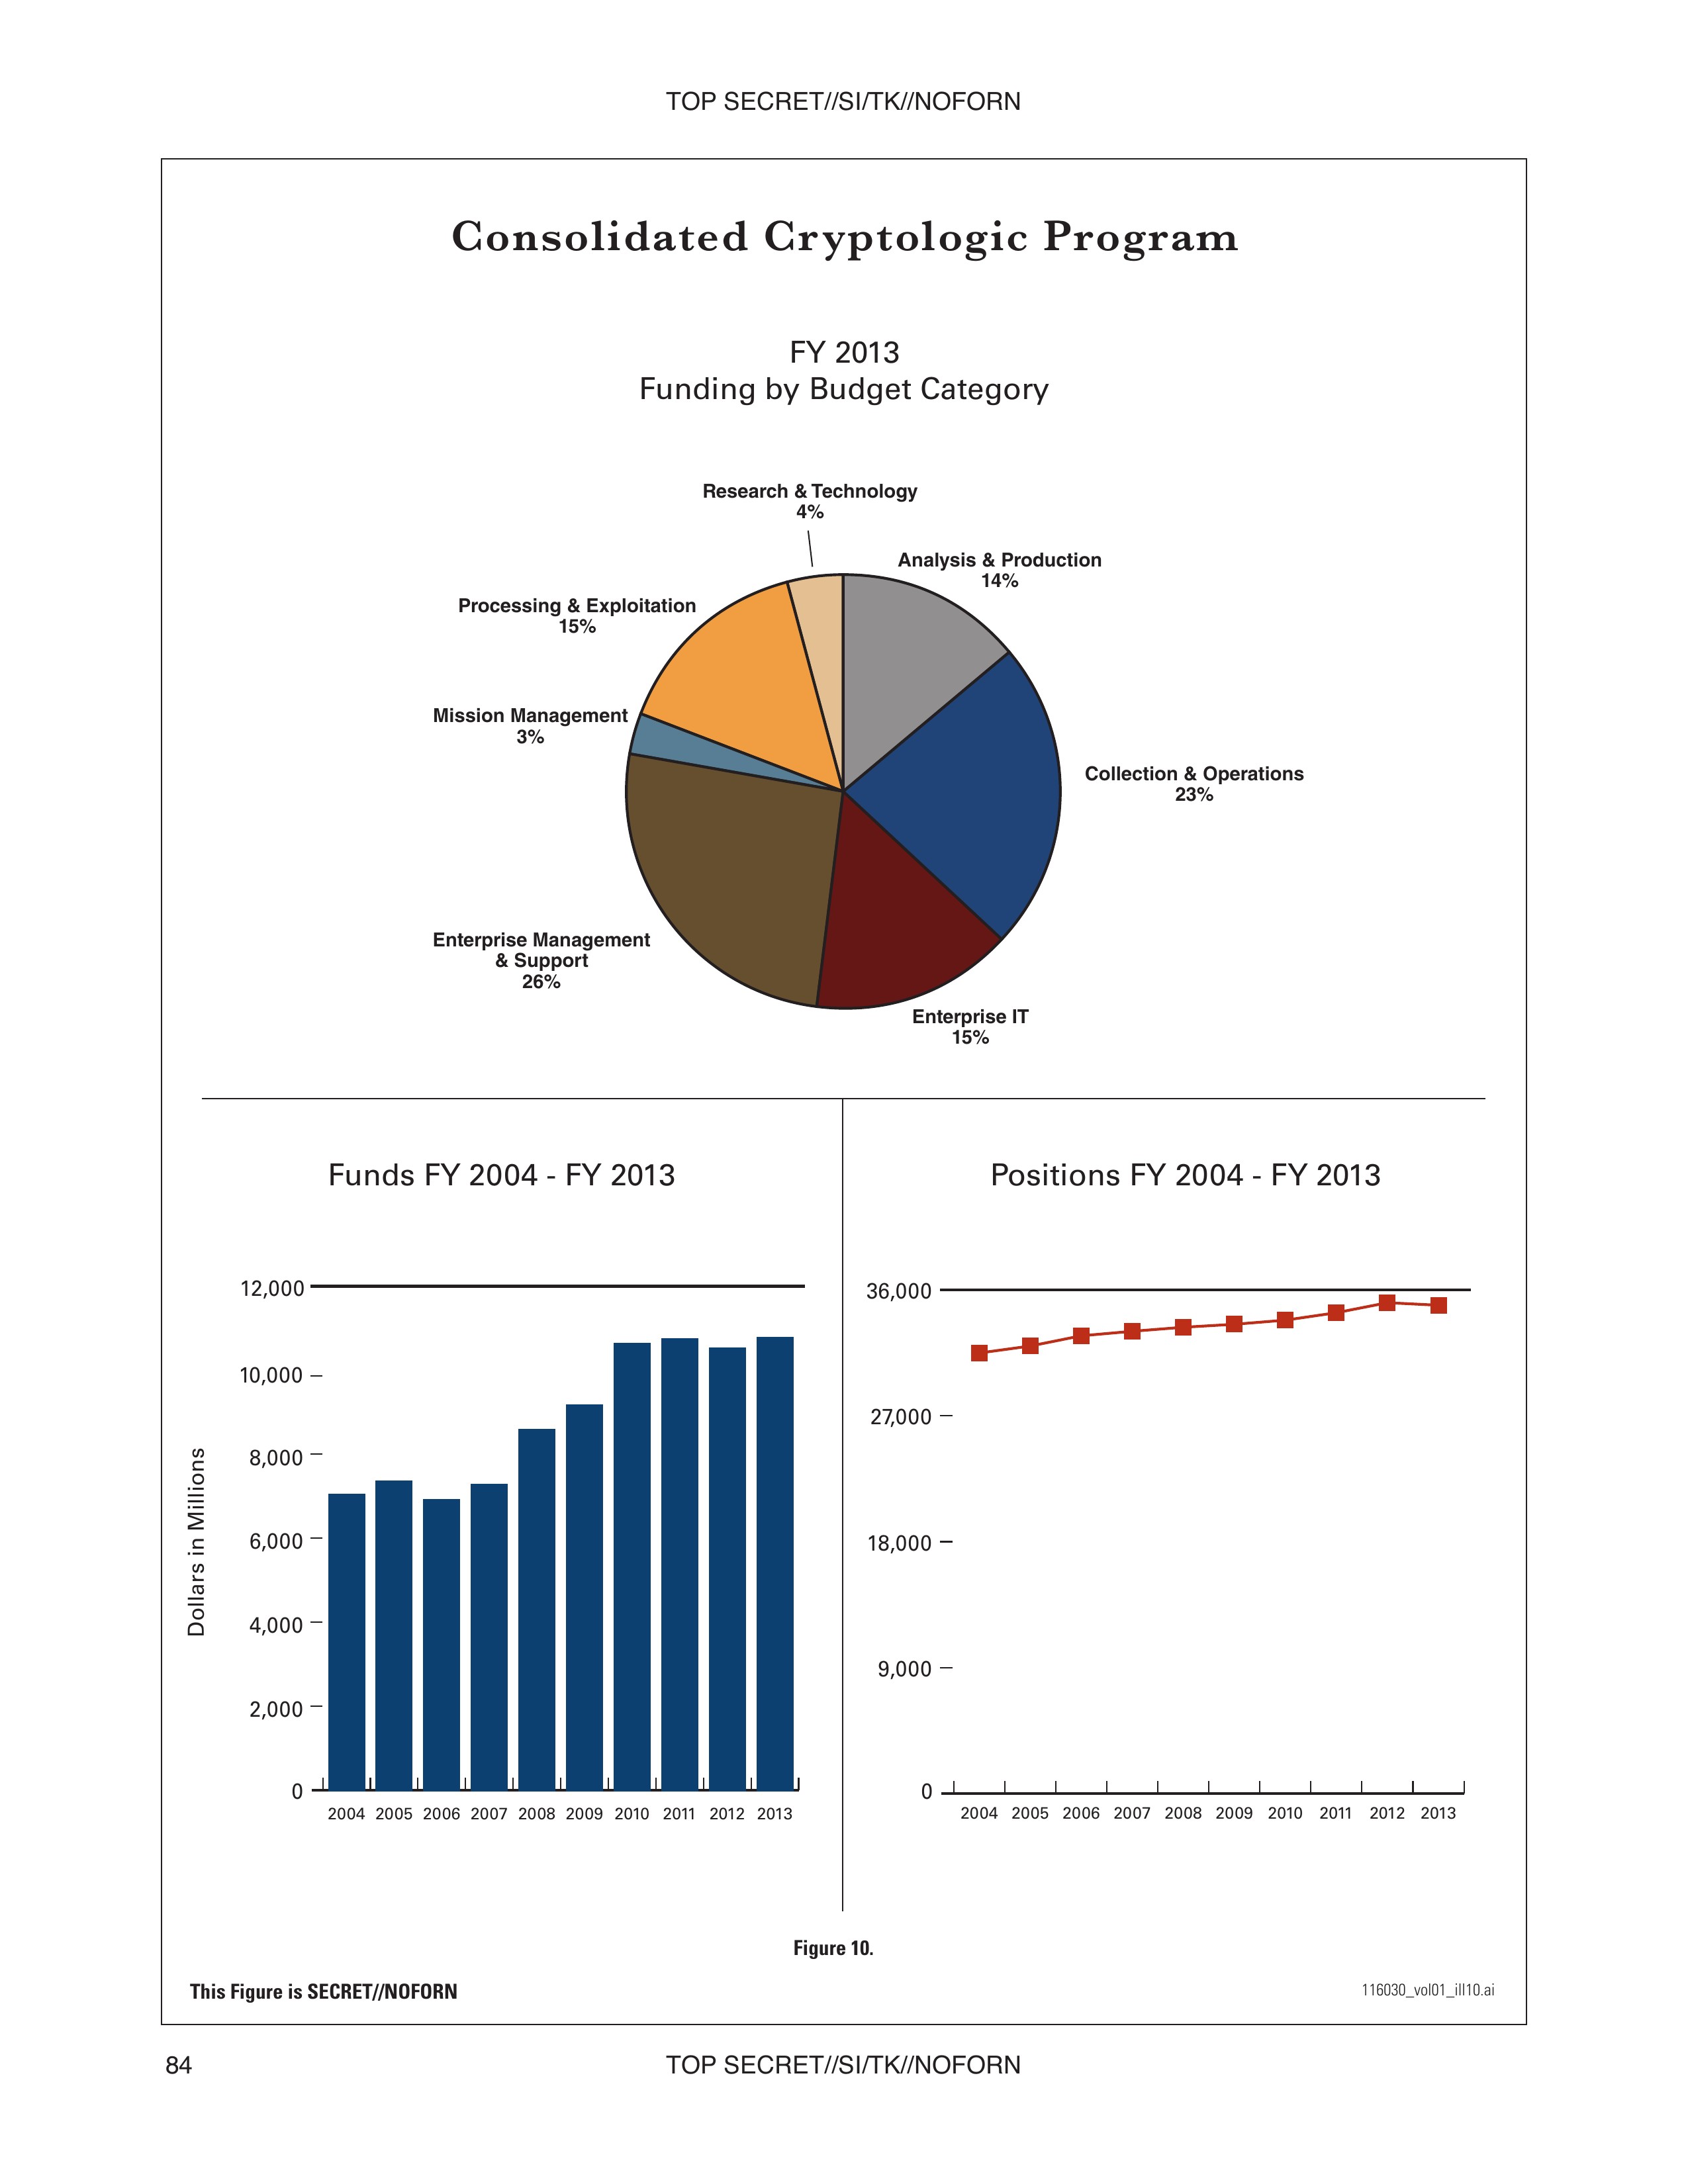
Consolidated Cryptologic Program
FY 2013

Funding by Budget Category

Collection & Operations 23%
Analysis & Production 14%
Research & Technology 4%
Processing & Exploitation 15%
Mission Management 3%
Enterprise Management & Support 26%
Enterprise IT 15%
Funds FY 2004 - FY 2013

Dollars in Millions

12,000
10,000
8,000
6,000
4,000
2,000
0
2004 2005 2006 2007 2008 2009 2010 2011 2012 2013
Positions FY 2004 - FY 2013

36,000
27,000
18,000
9,000
0
2004 2005 2006 2007 2008 2009 2010 2011 2012 2013
Figure 10.
This Figure is SECRET//NOFORN
116030_vol01_ill10.ai
TOP SECRET//SI/TK//NOFORN
84
TOP SECRET//SI/TK//NOFORN
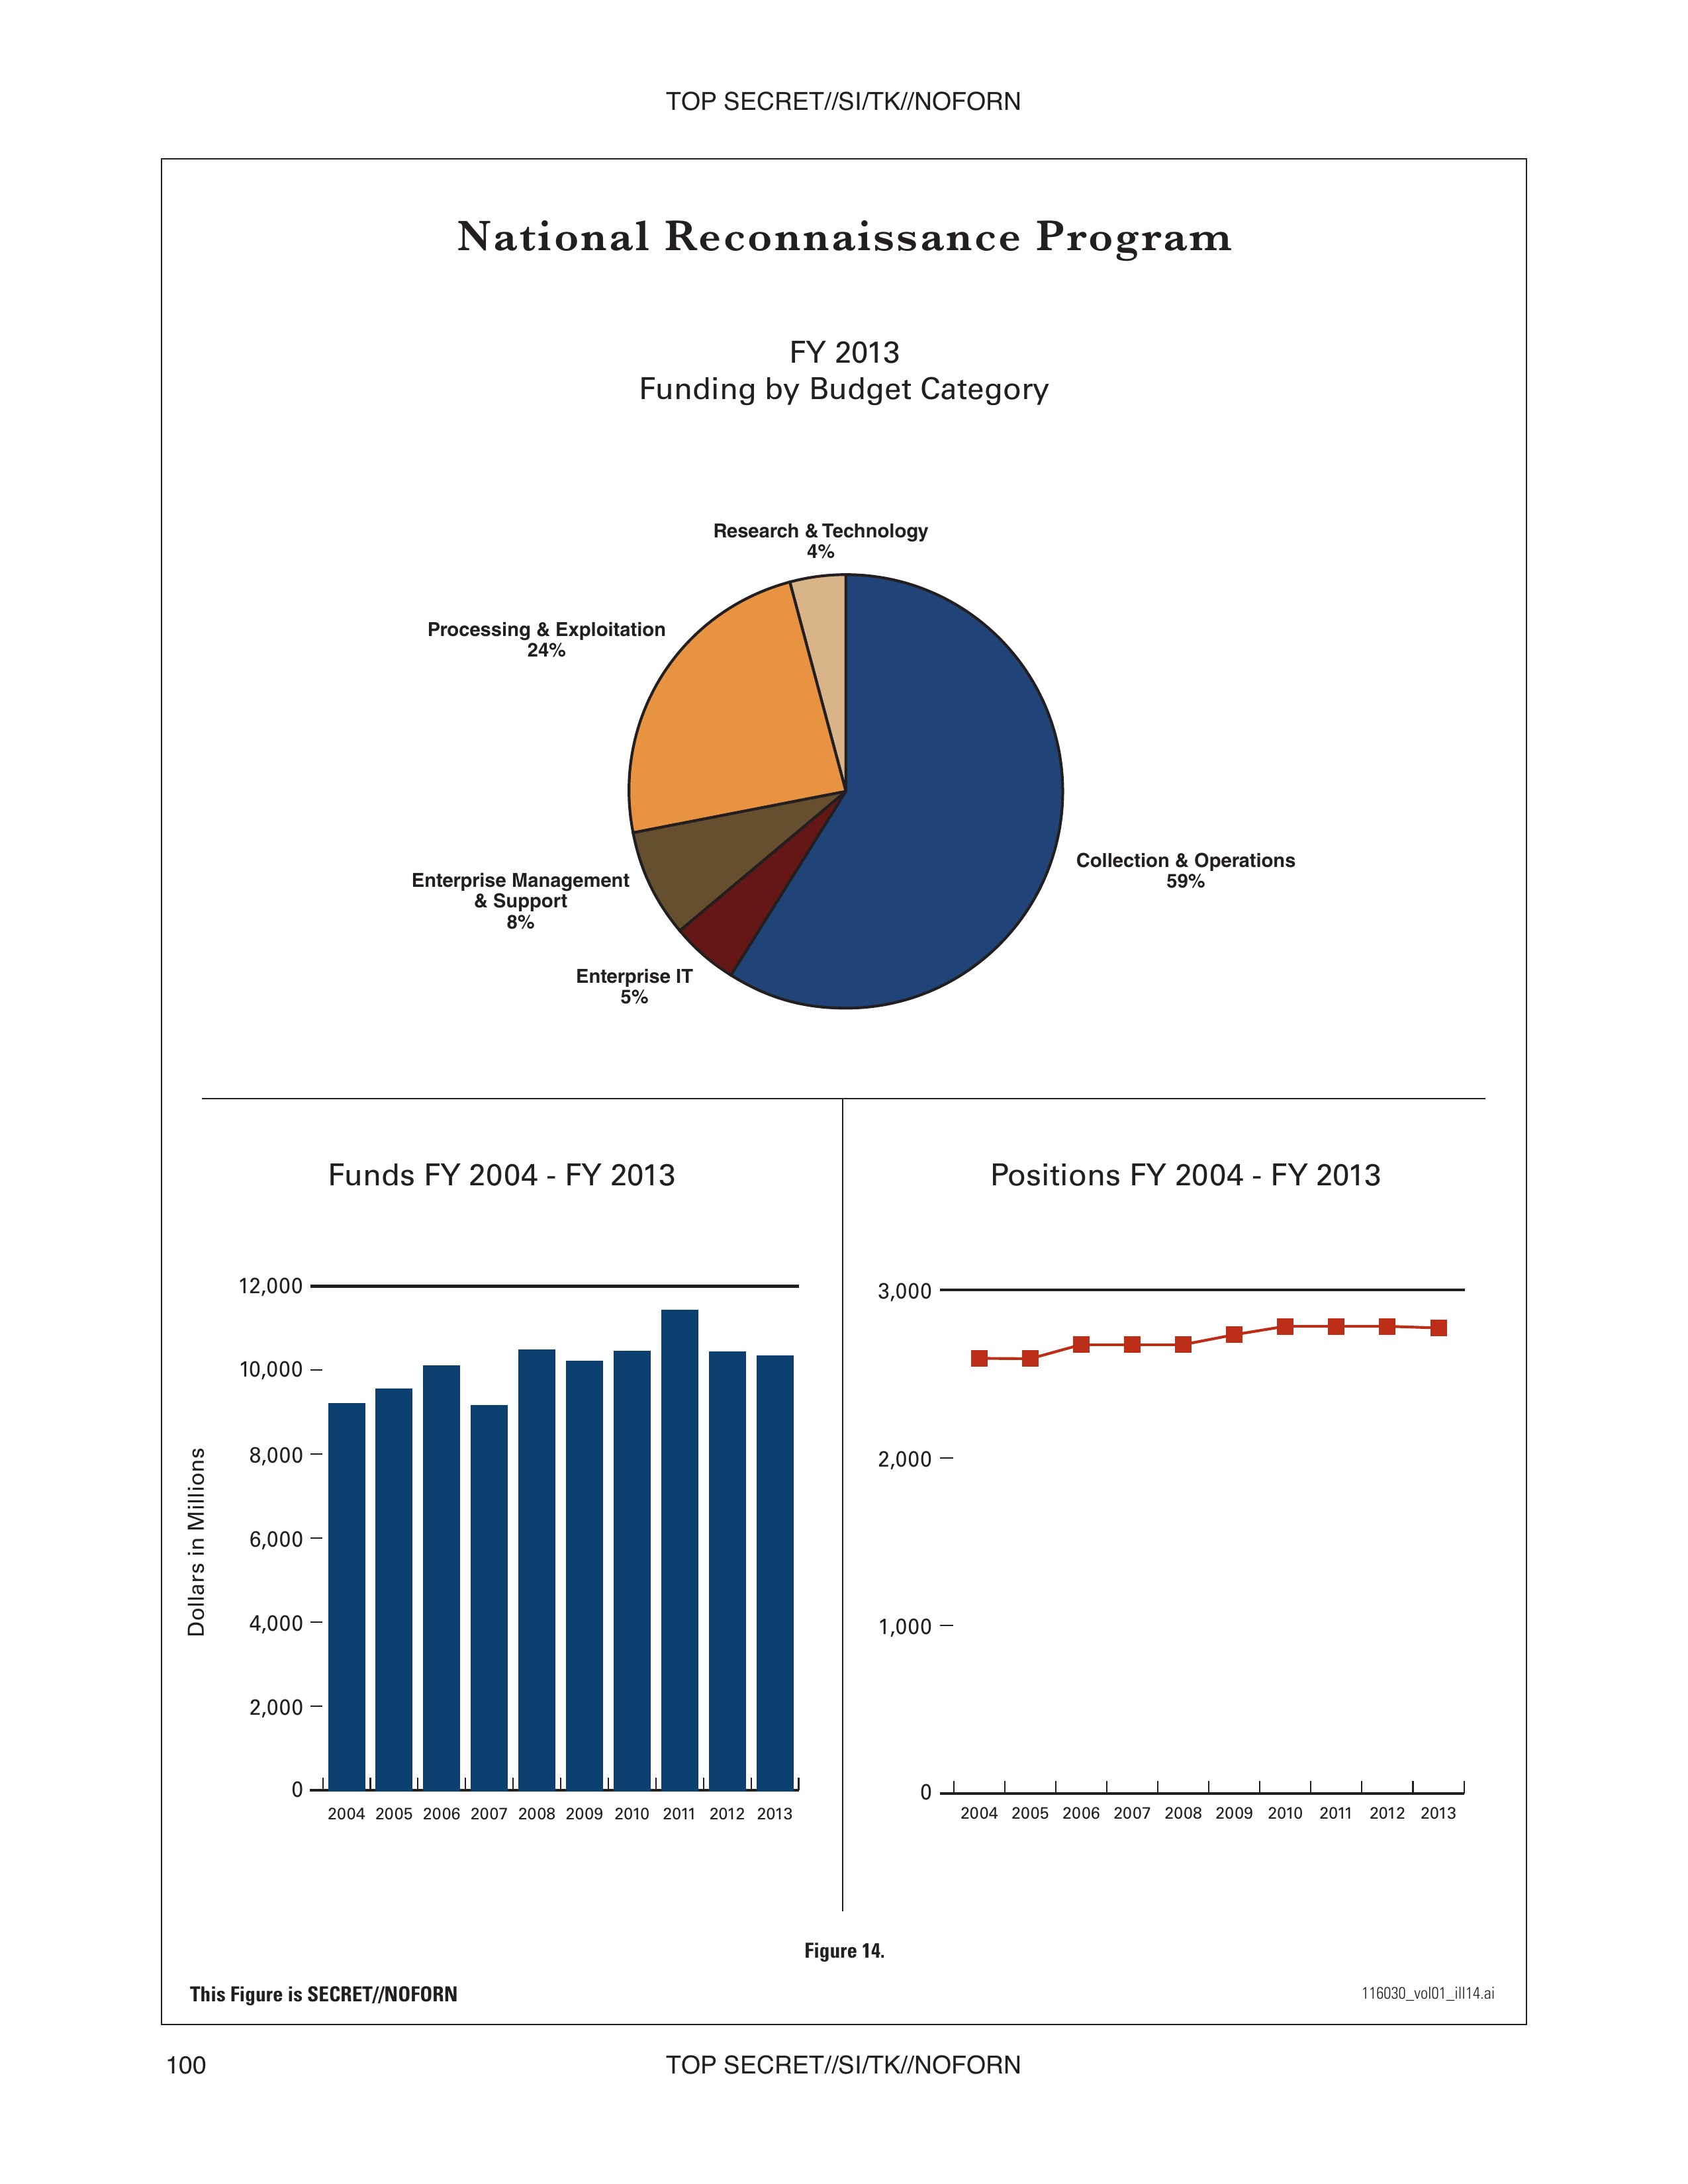
National Reconnaissance Program
FY 2013
Funding by Budget Category

Collection & Operations 59%
Processing & Exploitation 24%
Research & Technology 4%
Enterprise Management & Support 8%
Enterprise IT 5%
Funds FY 2004 - FY 2013

Dollars in Millions
12,000
10,000
8,000
6,000
4,000
2,000
0
2004 2005 2006 2007 2008 2009 2010 2011 2012 2013
Positions FY 2004 - FY 2013
3,000
2,000
1,000
0
2004 2005 2006 2007 2008 2009 2010 2011 2012 2013
Figure 14.
This Figure is SECRET//NOFORN
116030_vol01_ill14.ai
TOP SECRET//SI/TK//NOFORN
100
TOP SECRET//SI/TK//NOFORN
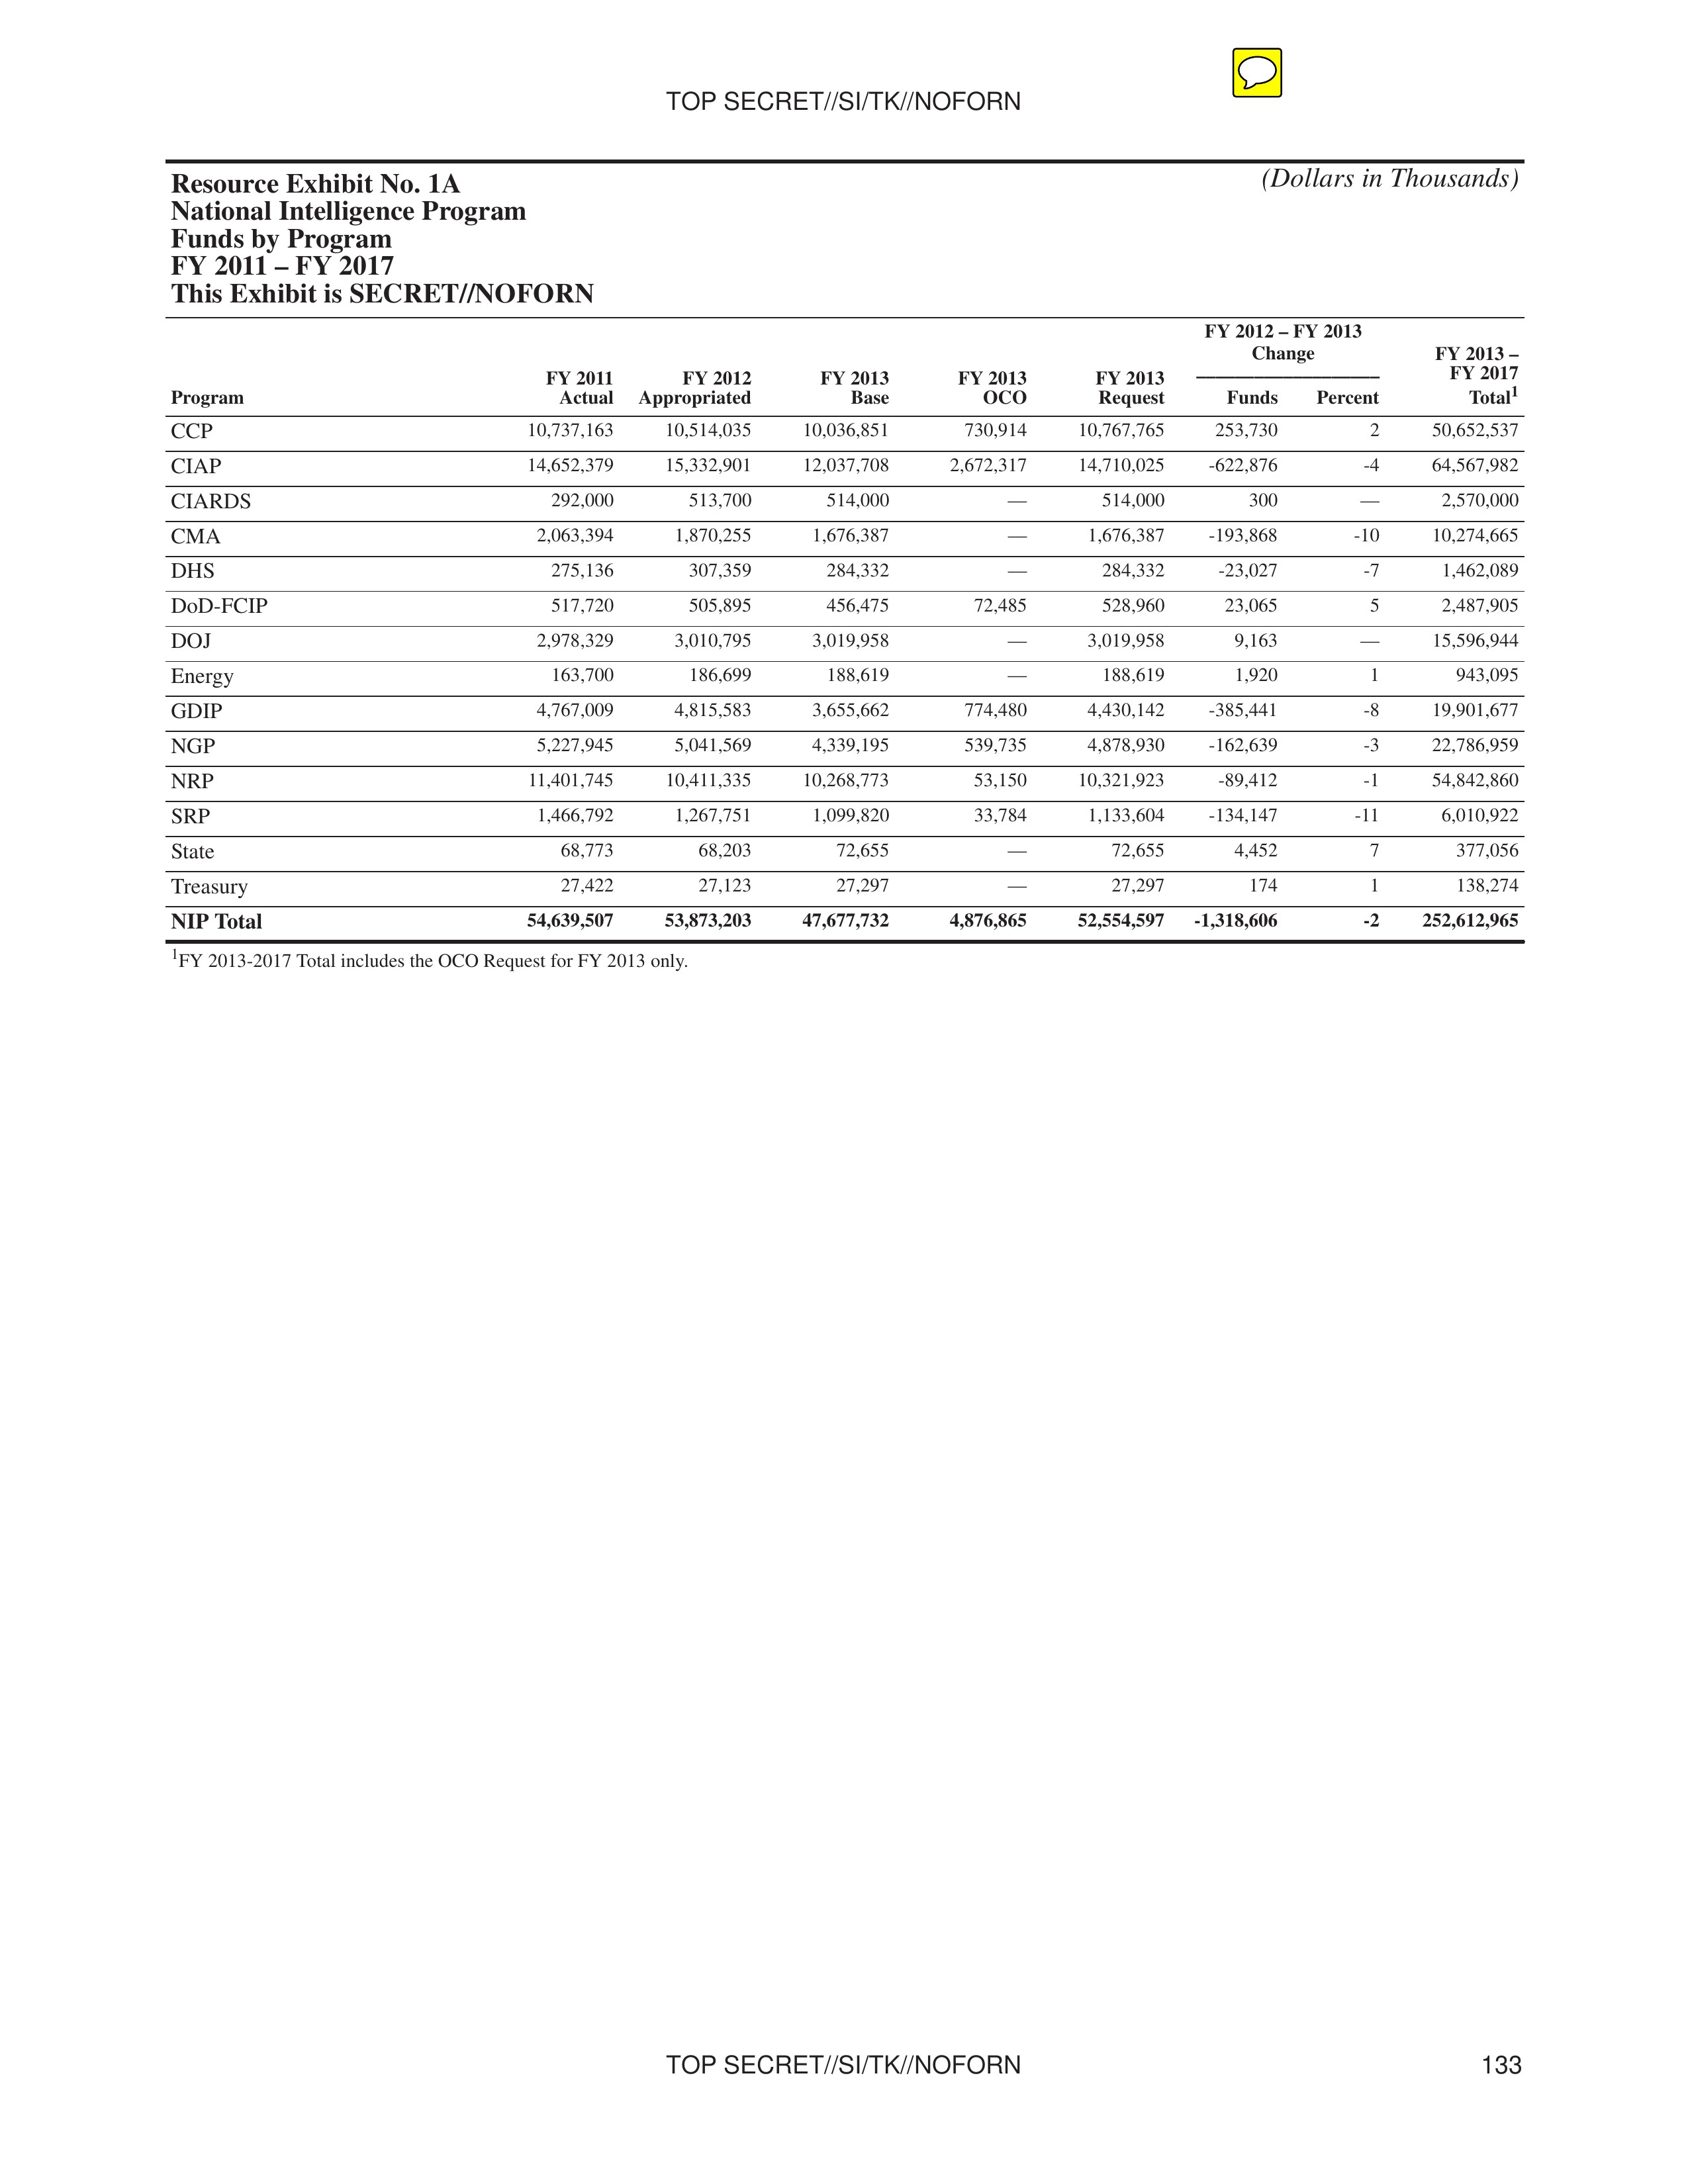
Resource Exhibit No. 1A
National Intelligence Program
Funds by Program
FY 2011 - FY 2017
This Exhibit is SECRET//NOFORN
(Dollars in Thousands)
| Program | FY 2011 Actual | FY 2012 Appropriated | FY 2013 Base | FY 2013 OCO | FY 2013 Request | FY 2012-FY 2013 Change Funds | FY 2012-FY 2013 Change Percent | FY 2013-FY 2017 Total¹ |
|---|---|---|---|---|---|---|---|---|
| CCP | 10,737,163 | 10,514,035 | 10,036,851 | 730,914 | 10,767,765 | 253,730 | 2 | 50,652,537 |
| CIAP | 14,652,379 | 15,332,901 | 12,037,708 | 2,672,317 | 14,710,025 | -622,876 | -4 | 64,567,982 |
| CIARDS | 292,000 | 513,700 | 514,000 | — | 514,000 | 300 | — | 2,570,000 |
| CMA | 2,063,394 | 1,870,255 | 1,676,387 | — | 1,676,387 | -193,868 | -10 | 10,274,665 |
| DHS | 275,136 | 307,359 | 284,332 | — | 284,332 | -23,027 | -7 | 1,462,089 |
| DOD-FCIP | 517,720 | 505,895 | 456,475 | 72,485 | 528,960 | 23,065 | 5 | 2,487,905 |
| DOJ | 2,978,329 | 3,010,795 | 3,019,958 | — | 3,019,958 | 9,163 | — | 15,596,944 |
| Energy | 163,700 | 186,699 | 188,619 | — | 188,619 | 1,920 | 1 | 943,095 |
| GDIP | 4,767,009 | 4,815,583 | 3,655,662 | 774,480 | 4,430,142 | -385,441 | -8 | 19,901,677 |
| NGP | 5,227,945 | 5,041,569 | 4,339,195 | 539,735 | 4,878,930 | -162,639 | -3 | 22,786,959 |
| NRP | 11,401,745 | 10,411,335 | 10,268,773 | 53,150 | 10,321,923 | -89,412 | -1 | 54,842,860 |
| SRP | 1,466,792 | 1,267,751 | 1,099,820 | 33,784 | 1,133,604 | -134,147 | -11 | 6,010,922 |
| State | 68,773 | 68,203 | 72,655 | — | 72,655 | 4,452 | 7 | 377,056 |
| Treasury | 27,422 | 27,123 | 27,297 | — | 27,297 | 174 | 1 | 138,274 |
| NIP Total | 54,639,507 | 53,873,203 | 47,677,732 | 4,876,865 | 52,554,597 | -1,318,606 | -2 | 252,612,965 |
¹FY 2013-2017 Total includes the OCO Request for FY 2013 only.
TOP SECRET//SI/TK//NOFORN
133
TOP SECRET//SI/TK//NOFORN
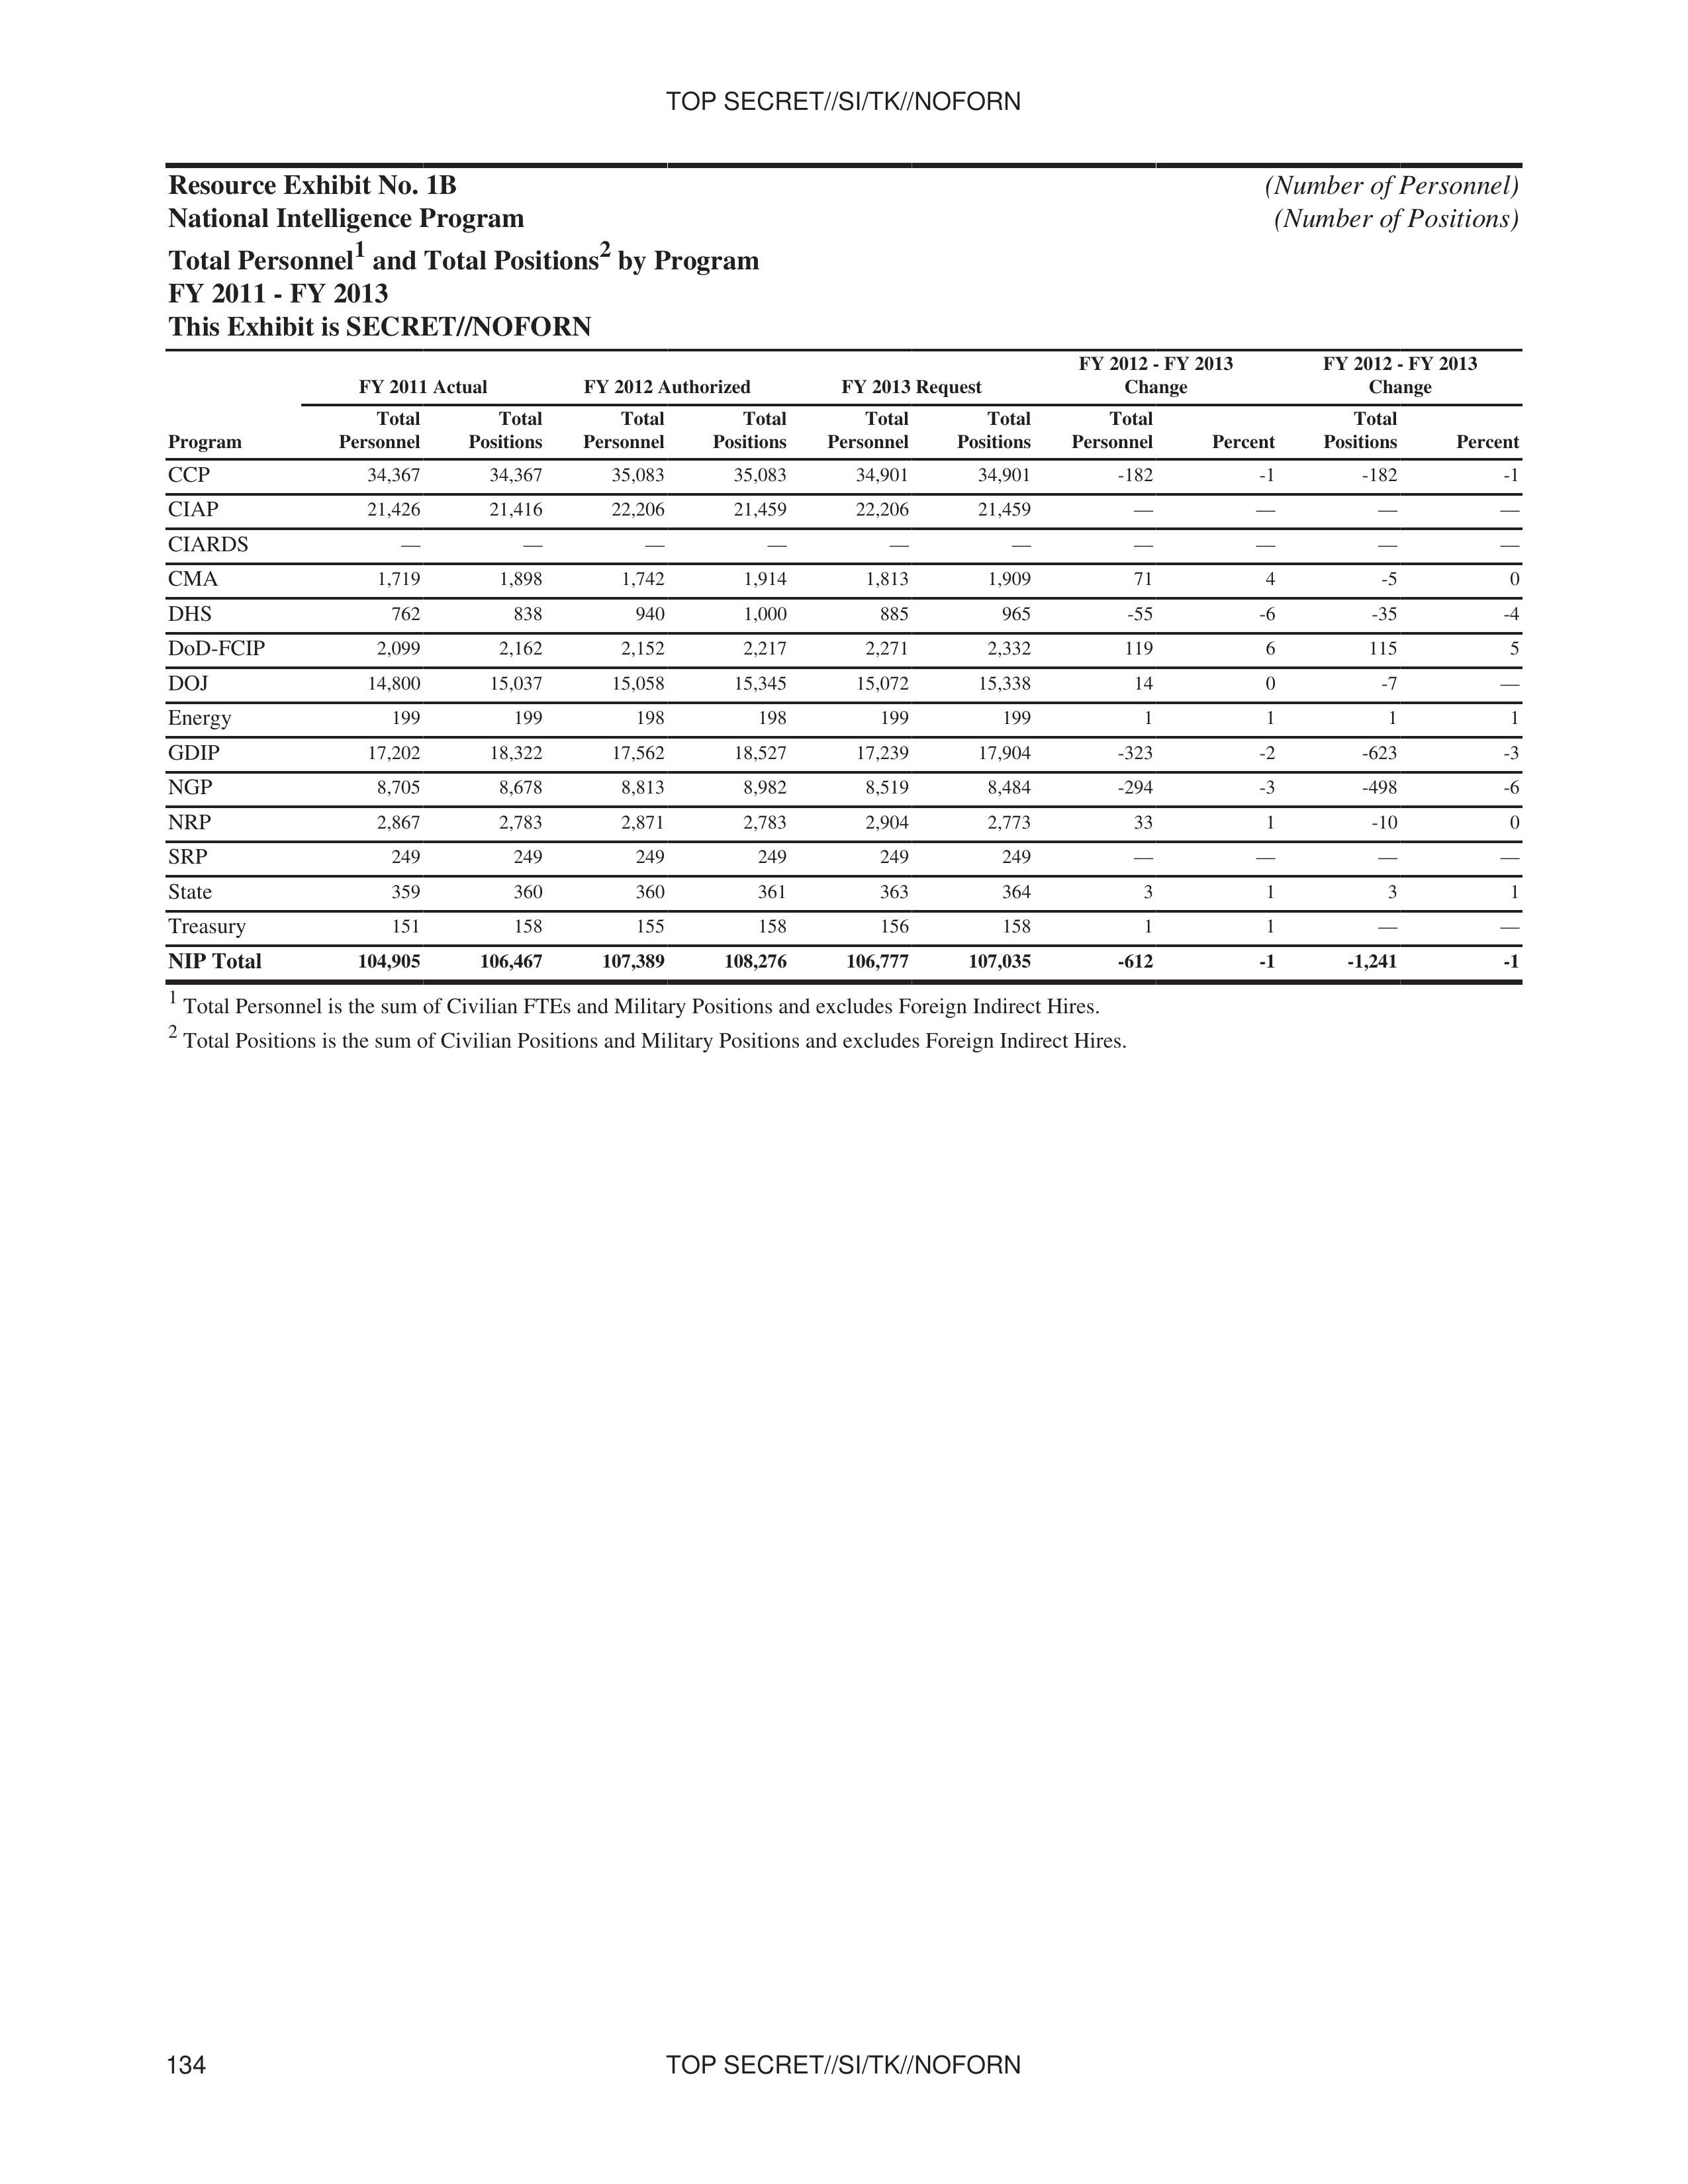
Resource Exhibit No. 1B
National Intelligence Program
Total Personnel¹ and Total Positions² by Program
FY 2011 - FY 2013
This Exhibit is SECRET//NOFORN
(Number of Personnel)
(Number of Positions)
| Program | FY 2011 Actual Total Personnel | FY 2011 Actual Total Positions | FY 2012 Authorized Total Personnel | FY 2012 Authorized Total Positions | FY 2013 Request Total Personnel | FY 2013 Request Total Positions | FY 2012 - FY 2013 Change Total Personnel | FY 2012 - FY 2013 Change Percent | FY 2012 - FY 2013 Change Total Positions | FY 2012 - FY 2013 Change Percent |
|---|---|---|---|---|---|---|---|---|---|---|
| CCP | 34,367 | 34,367 | 35,083 | 35,083 | 34,901 | 34,901 | -182 | -1 | -182 | -1 |
| CIAP | 21,426 | 21,416 | 22,206 | 21,459 | 22,206 | 21,459 | — | — | — | — |
| CIARDS | — | — | — | — | — | — | — | — | — | — |
| CMA | 1,719 | 1,898 | 1,742 | 1,914 | 1,813 | 1,909 | 71 | 4 | -5 | 0 |
| DHS | 762 | 838 | 940 | 1,000 | 885 | 965 | -55 | -6 | -35 | -4 |
| DOD-FCIP | 2,099 | 2,162 | 2,152 | 2,217 | 2,271 | 2,332 | 119 | 6 | 115 | 5 |
| DOJ | 14,800 | 15,037 | 15,058 | 15,345 | 15,072 | 15,338 | 14 | 0 | -7 | — |
| Energy | 199 | 199 | 198 | 198 | 199 | 199 | 1 | 1 | 1 | 1 |
| GDIP | 17,202 | 18,322 | 17,562 | 18,527 | 17,239 | 17,904 | -323 | -2 | -623 | -3 |
| NGP | 8,705 | 8,678 | 8,813 | 8,982 | 8,519 | 8,484 | -294 | -3 | -498 | -6 |
| NRP | 2,867 | 2,783 | 2,871 | 2,783 | 2,904 | 2,773 | 33 | 1 | -10 | 0 |
| SRP | 249 | 249 | 249 | 249 | 249 | 249 | — | — | — | — |
| State | 359 | 360 | 360 | 361 | 363 | 364 | 3 | 1 | 3 | 1 |
| Treasury | 151 | 158 | 155 | 158 | 156 | 158 | 1 | 1 | — | — |
| NIP Total | 104,905 | 106,467 | 107,389 | 108,276 | 106,777 | 107,035 | -612 | -1 | -1,241 | -1 |
¹ Total Personnel is the sum of Civilian FTEs and Military Positions and excludes Foreign Indirect Hires.
² Total Positions is the sum of Civilian Positions and Military Positions and excludes Foreign Indirect Hires.
TOP SECRET//SI/TK//NOFORN
134
TOP SECRET//SI/TK//NOFORN
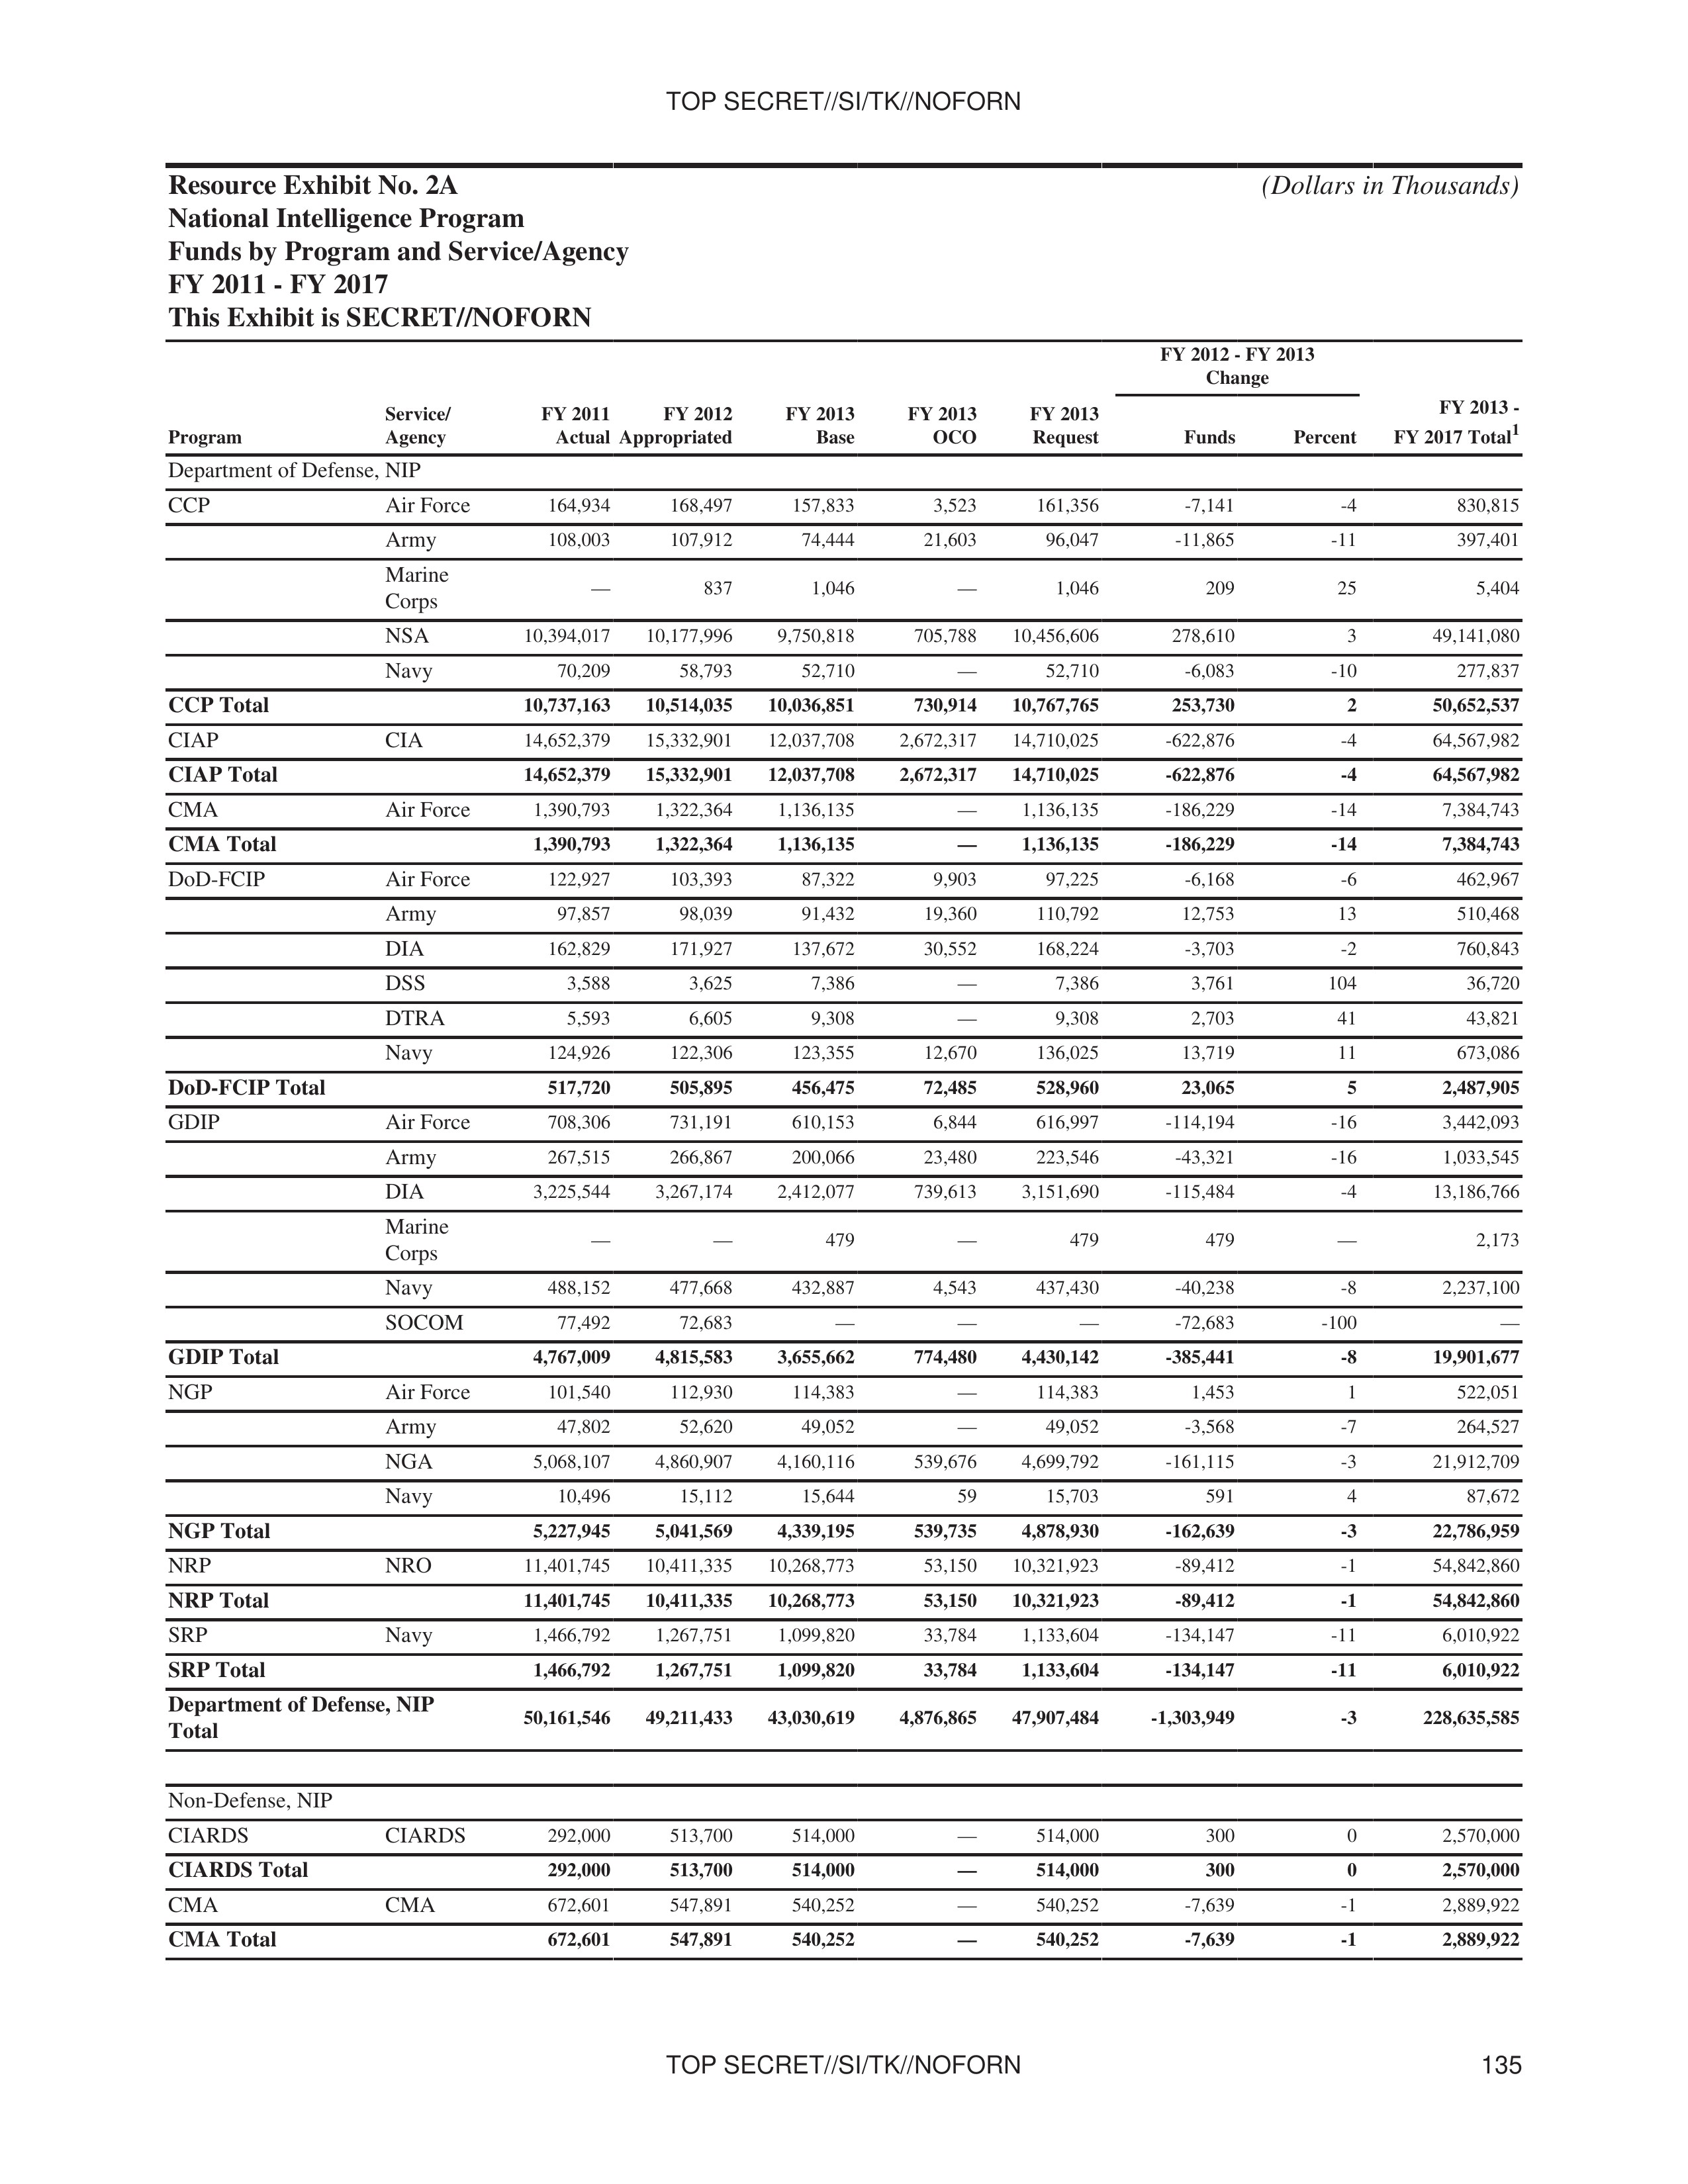
Resource Exhibit No. 2A
National Intelligence Program
Funds by Program and Service/Agency
FY 2011 - FY 2017
This Exhibit is SECRET//NOFORN
(Dollars in Thousands)
| Program | Service/Agency | FY 2011 Actual | FY 2012 Appropriated | FY 2013 Base | FY 2013 OCO | FY 2013 Request | FY 2012-FY 2013 Change Funds | FY 2012-FY 2013 Change Percent | FY 2013-FY 2017 Total¹ |
|---|---|---|---|---|---|---|---|---|---|
| Department of Defense, NIP | |||||||||
| CCP | Air Force | 164,934 | 168,497 | 157,833 | 3,523 | 161,356 | -7,141 | -4 | 830,815 |
| Army | 108,003 | 107,912 | 74,444 | 21,603 | 96,047 | -11,865 | -11 | 397,401 | |
| Marine Corps | — | 837 | 1,046 | — | 1,046 | 209 | 25 | 5,404 | |
| NSA | 10,394,017 | 10,177,996 | 9,750,818 | 705,788 | 10,456,606 | 278,610 | 3 | 49,141,080 | |
| Navy | 70,209 | 58,793 | 52,710 | — | 52,710 | -6,083 | -10 | 277,837 | |
| CCP Total | 10,737,163 | 10,514,035 | 10,036,851 | 730,914 | 10,767,765 | 253,730 | 2 | 50,652,537 | |
| CIAP | CIA | 14,652,379 | 15,332,901 | 12,037,708 | 2,672,317 | 14,710,025 | -622,876 | -4 | 64,567,982 |
| CIAP Total | 14,652,379 | 15,332,901 | 12,037,708 | 2,672,317 | 14,710,025 | -622,876 | -4 | 64,567,982 | |
| CMA | Air Force | 1,390,793 | 1,322,364 | 1,136,135 | — | 1,136,135 | -186,229 | -14 | 7,384,743 |
| CMA Total | 1,390,793 | 1,322,364 | 1,136,135 | — | 1,136,135 | -186,229 | -14 | 7,384,743 | |
| DOD-FCIP | Air Force | 122,927 | 103,393 | 87,322 | 9,903 | 97,225 | -6,168 | -6 | 462,967 |
| Army | 97,857 | 98,039 | 91,432 | 19,360 | 110,792 | 12,753 | 13 | 510,468 | |
| DIA | 162,829 | 171,927 | 137,672 | 30,552 | 168,224 | -3,703 | -2 | 760,843 | |
| DSS | 3,588 | 3,625 | 7,386 | — | 7,386 | 3,761 | 104 | 36,720 | |
| DTRA | 5,593 | 6,605 | 9,308 | — | 9,308 | 2,703 | 41 | 43,821 | |
| Navy | 124,926 | 122,306 | 123,355 | 12,670 | 136,025 | 13,719 | 11 | 673,086 | |
| DOD-FCIP Total | 517,720 | 505,895 | 456,475 | 72,485 | 528,960 | 23,065 | 5 | 2,487,905 | |
| GDIP | Air Force | 708,306 | 731,191 | 610,153 | 6,844 | 616,997 | -114,194 | -16 | 3,442,093 |
| Army | 267,515 | 266,867 | 200,066 | 23,480 | 223,546 | -43,321 | -16 | 1,033,545 | |
| DIA | 3,225,544 | 3,267,174 | 2,412,077 | 739,613 | 3,151,690 | -115,484 | -4 | 13,186,766 | |
| Marine Corps | — | — | 479 | — | 479 | 479 | — | 2,173 | |
| Navy | 488,152 | 477,668 | 432,887 | 4,543 | 437,430 | -40,238 | -8 | 2,237,100 | |
| SOCOM | 77,492 | 72,683 | — | — | — | -72,683 | -100 | — | |
| GDIP Total | 4,767,009 | 4,815,583 | 3,655,662 | 774,480 | 4,430,142 | -385,441 | -8 | 19,901,677 | |
| NGP | Air Force | 101,540 | 112,930 | 114,383 | — | 114,383 | 1,453 | 1 | 522,051 |
| Army | 47,802 | 52,620 | 49,052 | — | 49,052 | -3,568 | -7 | 264,527 | |
| NGA | 5,068,107 | 4,860,907 | 4,160,116 | 539,676 | 4,699,792 | -161,115 | -3 | 21,912,709 | |
| Navy | 10,496 | 15,112 | 15,644 | 59 | 15,703 | 591 | 4 | 87,672 | |
| NGP Total | 5,227,945 | 5,041,569 | 4,339,195 | 539,735 | 4,878,930 | -162,639 | -3 | 22,786,959 | |
| NRP | NRO | 11,401,745 | 10,411,335 | 10,268,773 | 53,150 | 10,321,923 | -89,412 | -1 | 54,842,860 |
| NRP Total | 11,401,745 | 10,411,335 | 10,268,773 | 53,150 | 10,321,923 | -89,412 | -1 | 54,842,860 | |
| SRP | Navy | 1,466,792 | 1,267,751 | 1,099,820 | 33,784 | 1,133,604 | -134,147 | -11 | 6,010,922 |
| SRP Total | 1,466,792 | 1,267,751 | 1,099,820 | 33,784 | 1,133,604 | -134,147 | -11 | 6,010,922 | |
| Department of Defense, NIP Total | 50,161,546 | 49,211,433 | 43,030,619 | 4,876,865 | 47,907,484 | -1,303,949 | -3 | 228,635,585 | |
| Non-Defense, NIP | |||||||||
| CIARDS | CIARDS | 292,000 | 513,700 | 514,000 | — | 514,000 | 300 | 0 | 2,570,000 |
| CIARDS Total | 292,000 | 513,700 | 514,000 | — | 514,000 | 300 | 0 | 2,570,000 | |
| CMA | CMA | 672,601 | 547,891 | 540,252 | — | 540,252 | -7,639 | -1 | 2,889,922 |
| CMA Total | 672,601 | 547,891 | 540,252 | — | 540,252 | -7,639 | -1 | 2,889,922 |
TOP SECRET//SI/TK//NOFORN
135
TOP SECRET//SI/TK//NOFORN
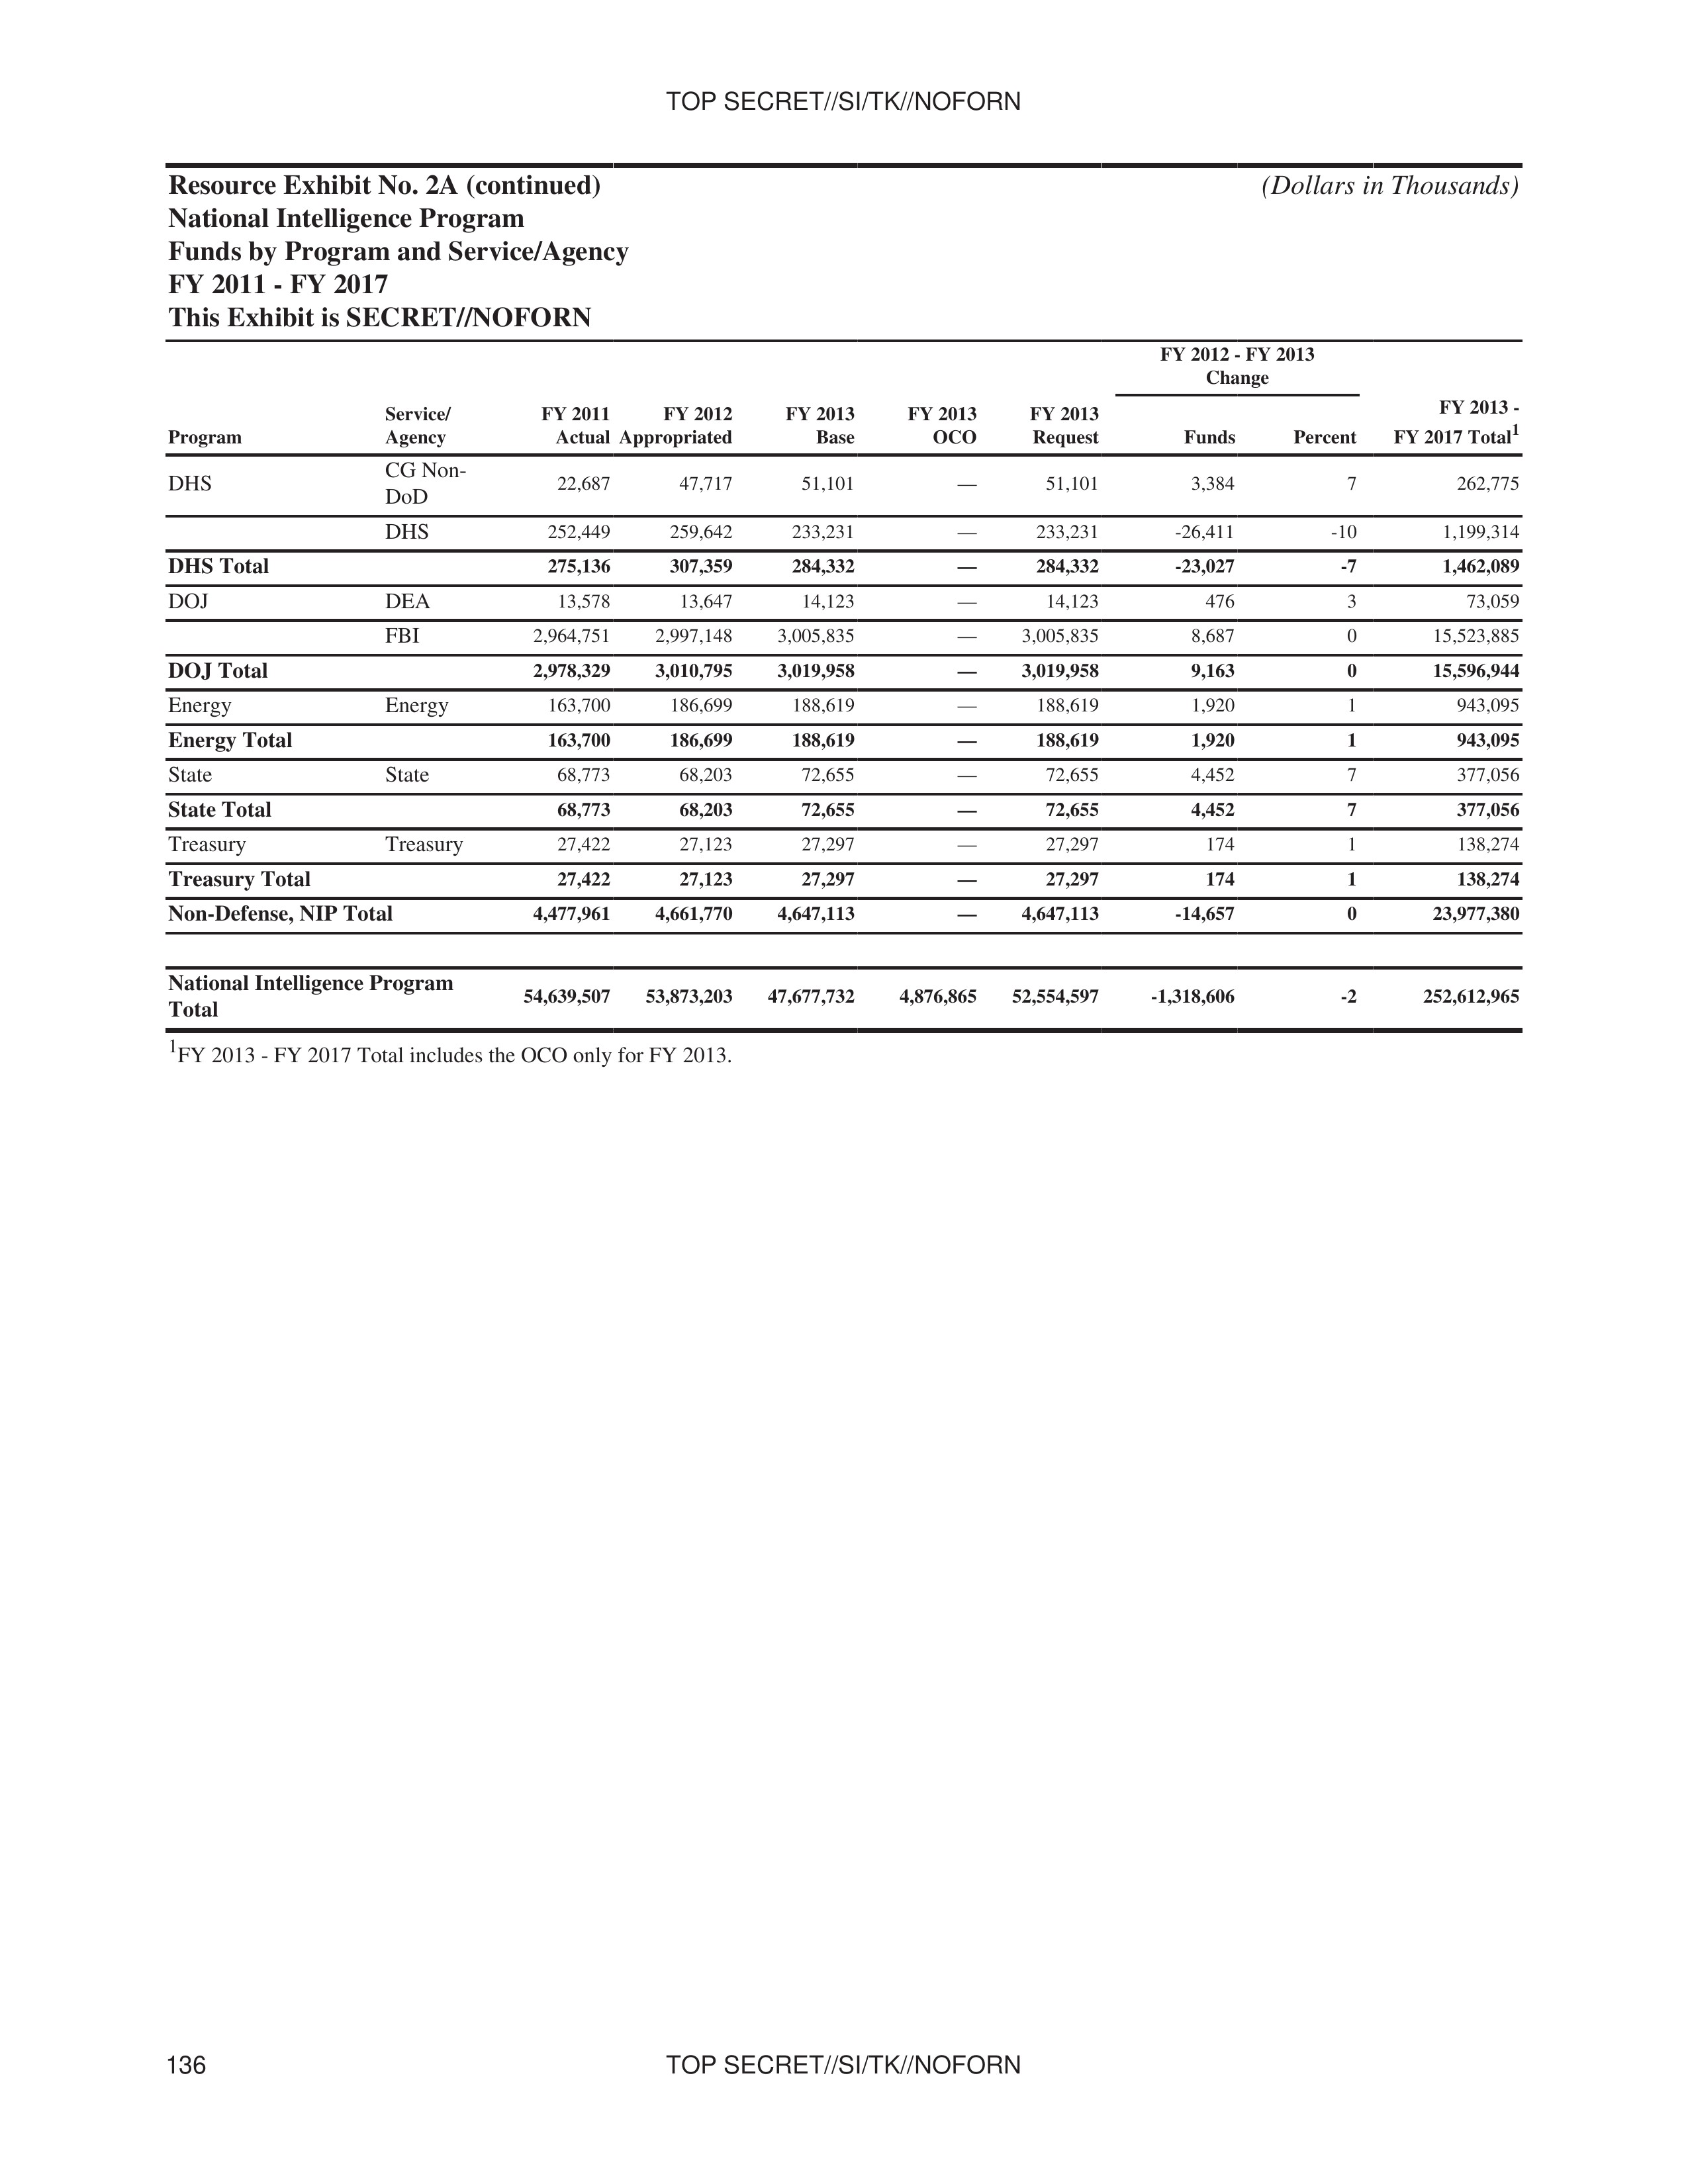
Resource Exhibit No. 2A (continued)
National Intelligence Program
Funds by Program and Service/Agency
FY 2011 - FY 2017
This Exhibit is SECRET//NOFORN
(Dollars in Thousands)
| Program | Service/Agency | FY 2011 Actual | FY 2012 Appropriated | FY 2013 Base | FY 2013 OCO | FY 2013 Request | FY 2012-FY 2013 Change Funds | FY 2012-FY 2013 Change Percent | FY 2013-FY 2017 Total¹ |
|---|---|---|---|---|---|---|---|---|---|
| DHS | CG Non-DoD | 22,687 | 47,717 | 51,101 | — | 51,101 | 3,384 | 7 | 262,775 |
| DHS | 252,449 | 259,642 | 233,231 | — | 233,231 | -26,411 | -10 | 1,199,314 | |
| DHS Total | 275,136 | 307,359 | 284,332 | — | 284,332 | -23,027 | -7 | 1,462,089 | |
| DOJ | DEA | 13,578 | 13,647 | 14,123 | — | 14,123 | 476 | 3 | 73,059 |
| FBI | 2,964,751 | 2,997,148 | 3,005,835 | — | 3,005,835 | 8,687 | 0 | 15,523,885 | |
| DOJ Total | 2,978,329 | 3,010,795 | 3,019,958 | — | 3,019,958 | 9,163 | 0 | 15,596,944 | |
| Energy | Energy | 163,700 | 186,699 | 188,619 | — | 188,619 | 1,920 | 1 | 943,095 |
| Energy Total | 163,700 | 186,699 | 188,619 | — | 188,619 | 1,920 | 1 | 943,095 | |
| State | State | 68,773 | 68,203 | 72,655 | — | 72,655 | 4,452 | 7 | 377,056 |
| State Total | 68,773 | 68,203 | 72,655 | — | 72,655 | 4,452 | 7 | 377,056 | |
| Treasury | Treasury | 27,422 | 27,123 | 27,297 | — | 27,297 | 174 | 1 | 138,274 |
| Treasury Total | 27,422 | 27,123 | 27,297 | — | 27,297 | 174 | 1 | 138,274 | |
| Non-Defense, NIP Total | 4,477,961 | 4,661,770 | 4,647,113 | — | 4,647,113 | -14,657 | 0 | 23,977,380 | |
| National Intelligence Program Total | 54,639,507 | 53,873,203 | 47,677,732 | 4,876,865 | 52,554,597 | -1,318,606 | -2 | 252,612,965 |
¹FY 2013 - FY 2017 Total includes the OCO only for FY 2013.
TOP SECRET//SI/TK//NOFORN
136
TOP SECRET//SI/TK//NOFORN
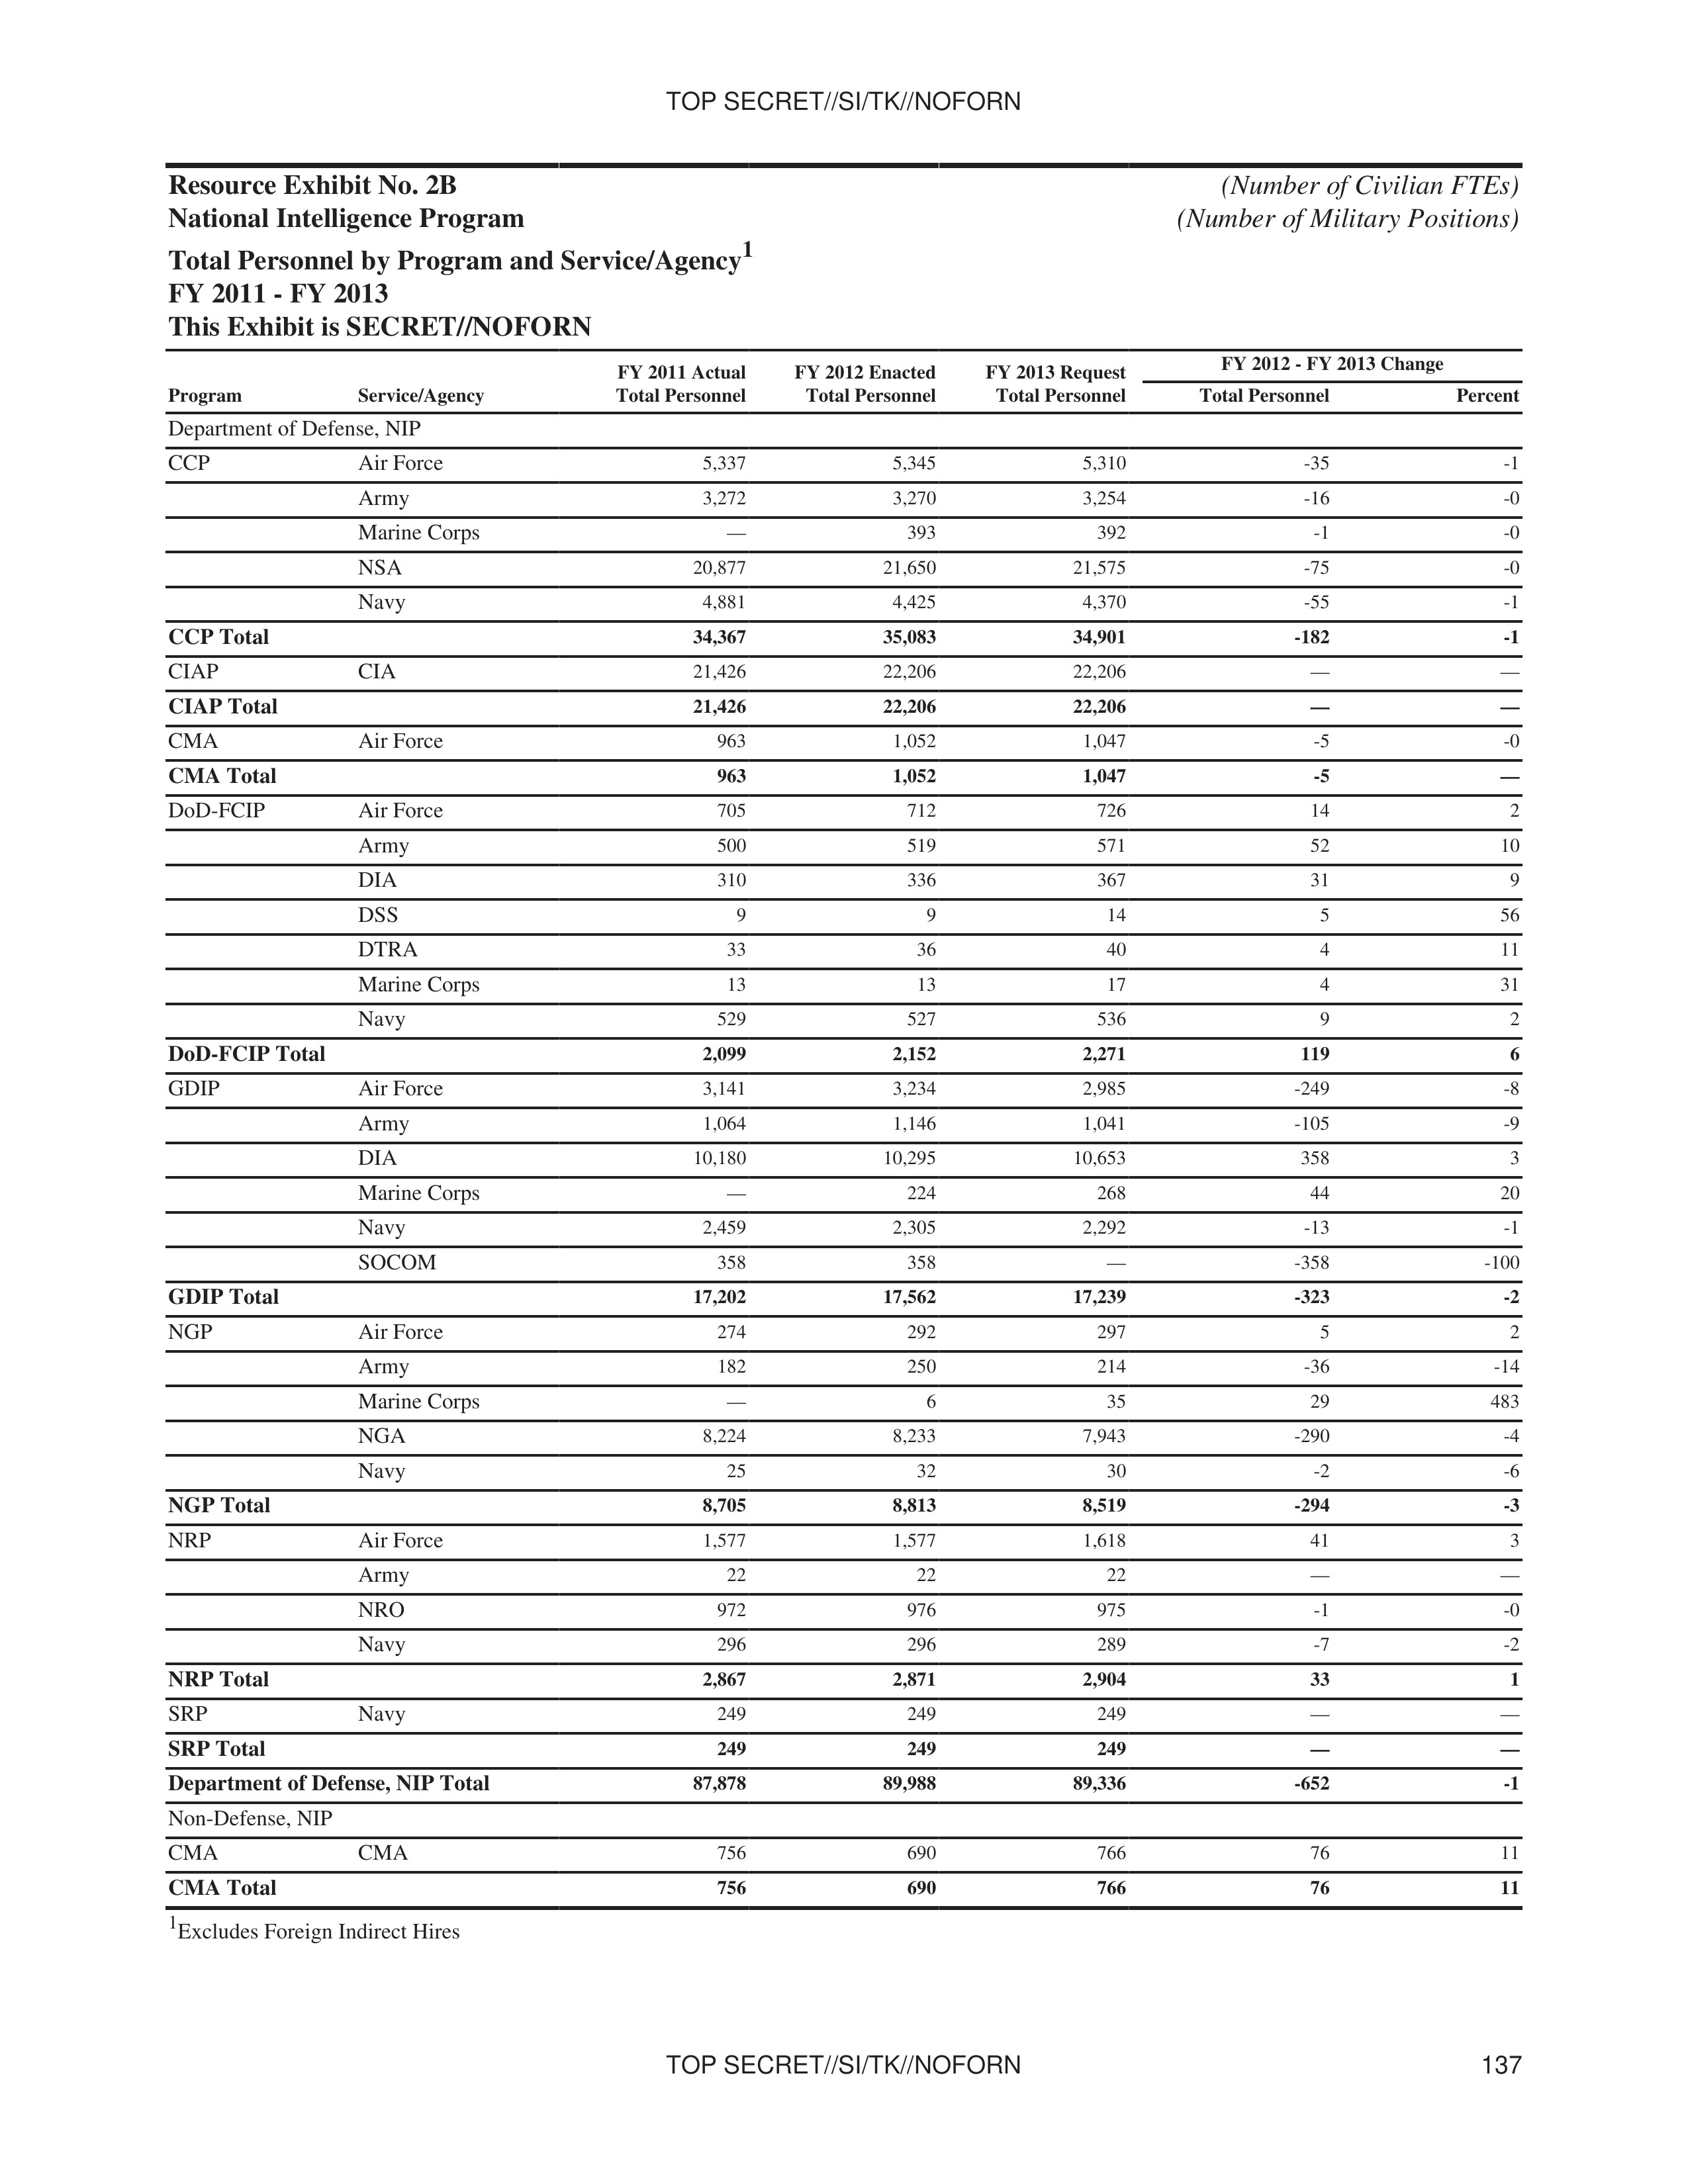
Resource Exhibit No. 2B
National Intelligence Program
Total Personnel by Program and Service/Agency¹
FY 2011 - FY 2013
This Exhibit is SECRET//NOFORN
(Number of Civilian FTEs)
(Number of Military Positions)
| Program | Service/Agency | FY 2011 Actual Total Personnel | FY 2012 Enacted Total Personnel | FY 2013 Request Total Personnel | FY 2012 - FY 2013 Change Total Personnel | FY 2012 - FY 2013 Change Percent |
|---|---|---|---|---|---|---|
| Department of Defense, NIP | ||||||
| CCP | Air Force | 5,337 | 5,345 | 5,310 | -35 | -1 |
| Army | 3,272 | 3,270 | 3,254 | -16 | -0 | |
| Marine Corps | — | 393 | 392 | -1 | -0 | |
| NSA | 20,877 | 21,650 | 21,575 | -75 | -0 | |
| Navy | 4,881 | 4,425 | 4,370 | -55 | -1 | |
| CCP Total | 34,367 | 35,083 | 34,901 | -182 | -1 | |
| CIAP | CIA | 21,426 | 22,206 | 22,206 | — | — |
| CIAP Total | 21,426 | 22,206 | 22,206 | — | — | |
| CMA | Air Force | 963 | 1,052 | 1,047 | -5 | -0 |
| CMA Total | 963 | 1,052 | 1,047 | -5 | — | |
| DOD-FCIP | Air Force | 705 | 712 | 726 | 14 | 2 |
| Army | 500 | 519 | 571 | 52 | 10 | |
| DIA | 310 | 336 | 367 | 31 | 9 | |
| DSS | 9 | 9 | 14 | 5 | 56 | |
| DTRA | 33 | 36 | 40 | 4 | 11 | |
| Marine Corps | 13 | 13 | 17 | 4 | 31 | |
| Navy | 529 | 527 | 536 | 9 | 2 | |
| DOD-FCIP Total | 2,099 | 2,152 | 2,271 | 119 | 6 | |
| GDIP | Air Force | 3,141 | 3,234 | 2,985 | -249 | -8 |
| Army | 1,064 | 1,146 | 1,041 | -105 | -9 | |
| DIA | 10,180 | 10,295 | 10,653 | 358 | 3 | |
| Marine Corps | — | 224 | 268 | 44 | 20 | |
| Navy | 2,459 | 2,305 | 2,292 | -13 | -1 | |
| SOCOM | 358 | 358 | — | -358 | -100 | |
| GDIP Total | 17,202 | 17,562 | 17,239 | -323 | -2 | |
| NGP | Air Force | 274 | 292 | 297 | 5 | 2 |
| Army | 182 | 250 | 214 | -36 | -14 | |
| Marine Corps | — | 6 | 35 | 29 | 483 | |
| NGA | 8,224 | 8,233 | 7,943 | -290 | -4 | |
| Navy | 25 | 32 | 30 | -2 | -6 | |
| NGP Total | 8,705 | 8,813 | 8,519 | -294 | -3 | |
| NRP | Air Force | 1,577 | 1,577 | 1,618 | 41 | 3 |
| Army | 22 | 22 | 22 | — | — | |
| NRO | 972 | 976 | 975 | -1 | -0 | |
| Navy | 296 | 296 | 289 | -7 | -2 | |
| NRP Total | 2,867 | 2,871 | 2,904 | 33 | 1 | |
| SRP | Navy | 249 | 249 | 249 | — | — |
| SRP Total | 249 | 249 | 249 | — | — | |
| Department of Defense, NIP Total | 87,878 | 89,988 | 89,336 | -652 | -1 | |
| Non-Defense, NIP | ||||||
| CMA | CMA | 756 | 690 | 766 | 76 | 11 |
| CMA Total | 756 | 690 | 766 | 76 | 11 |
¹ Excludes Foreign Indirect Hires
TOP SECRET//SI/TK//NOFORN
137
TOP SECRET//SI/TK//NOFORN
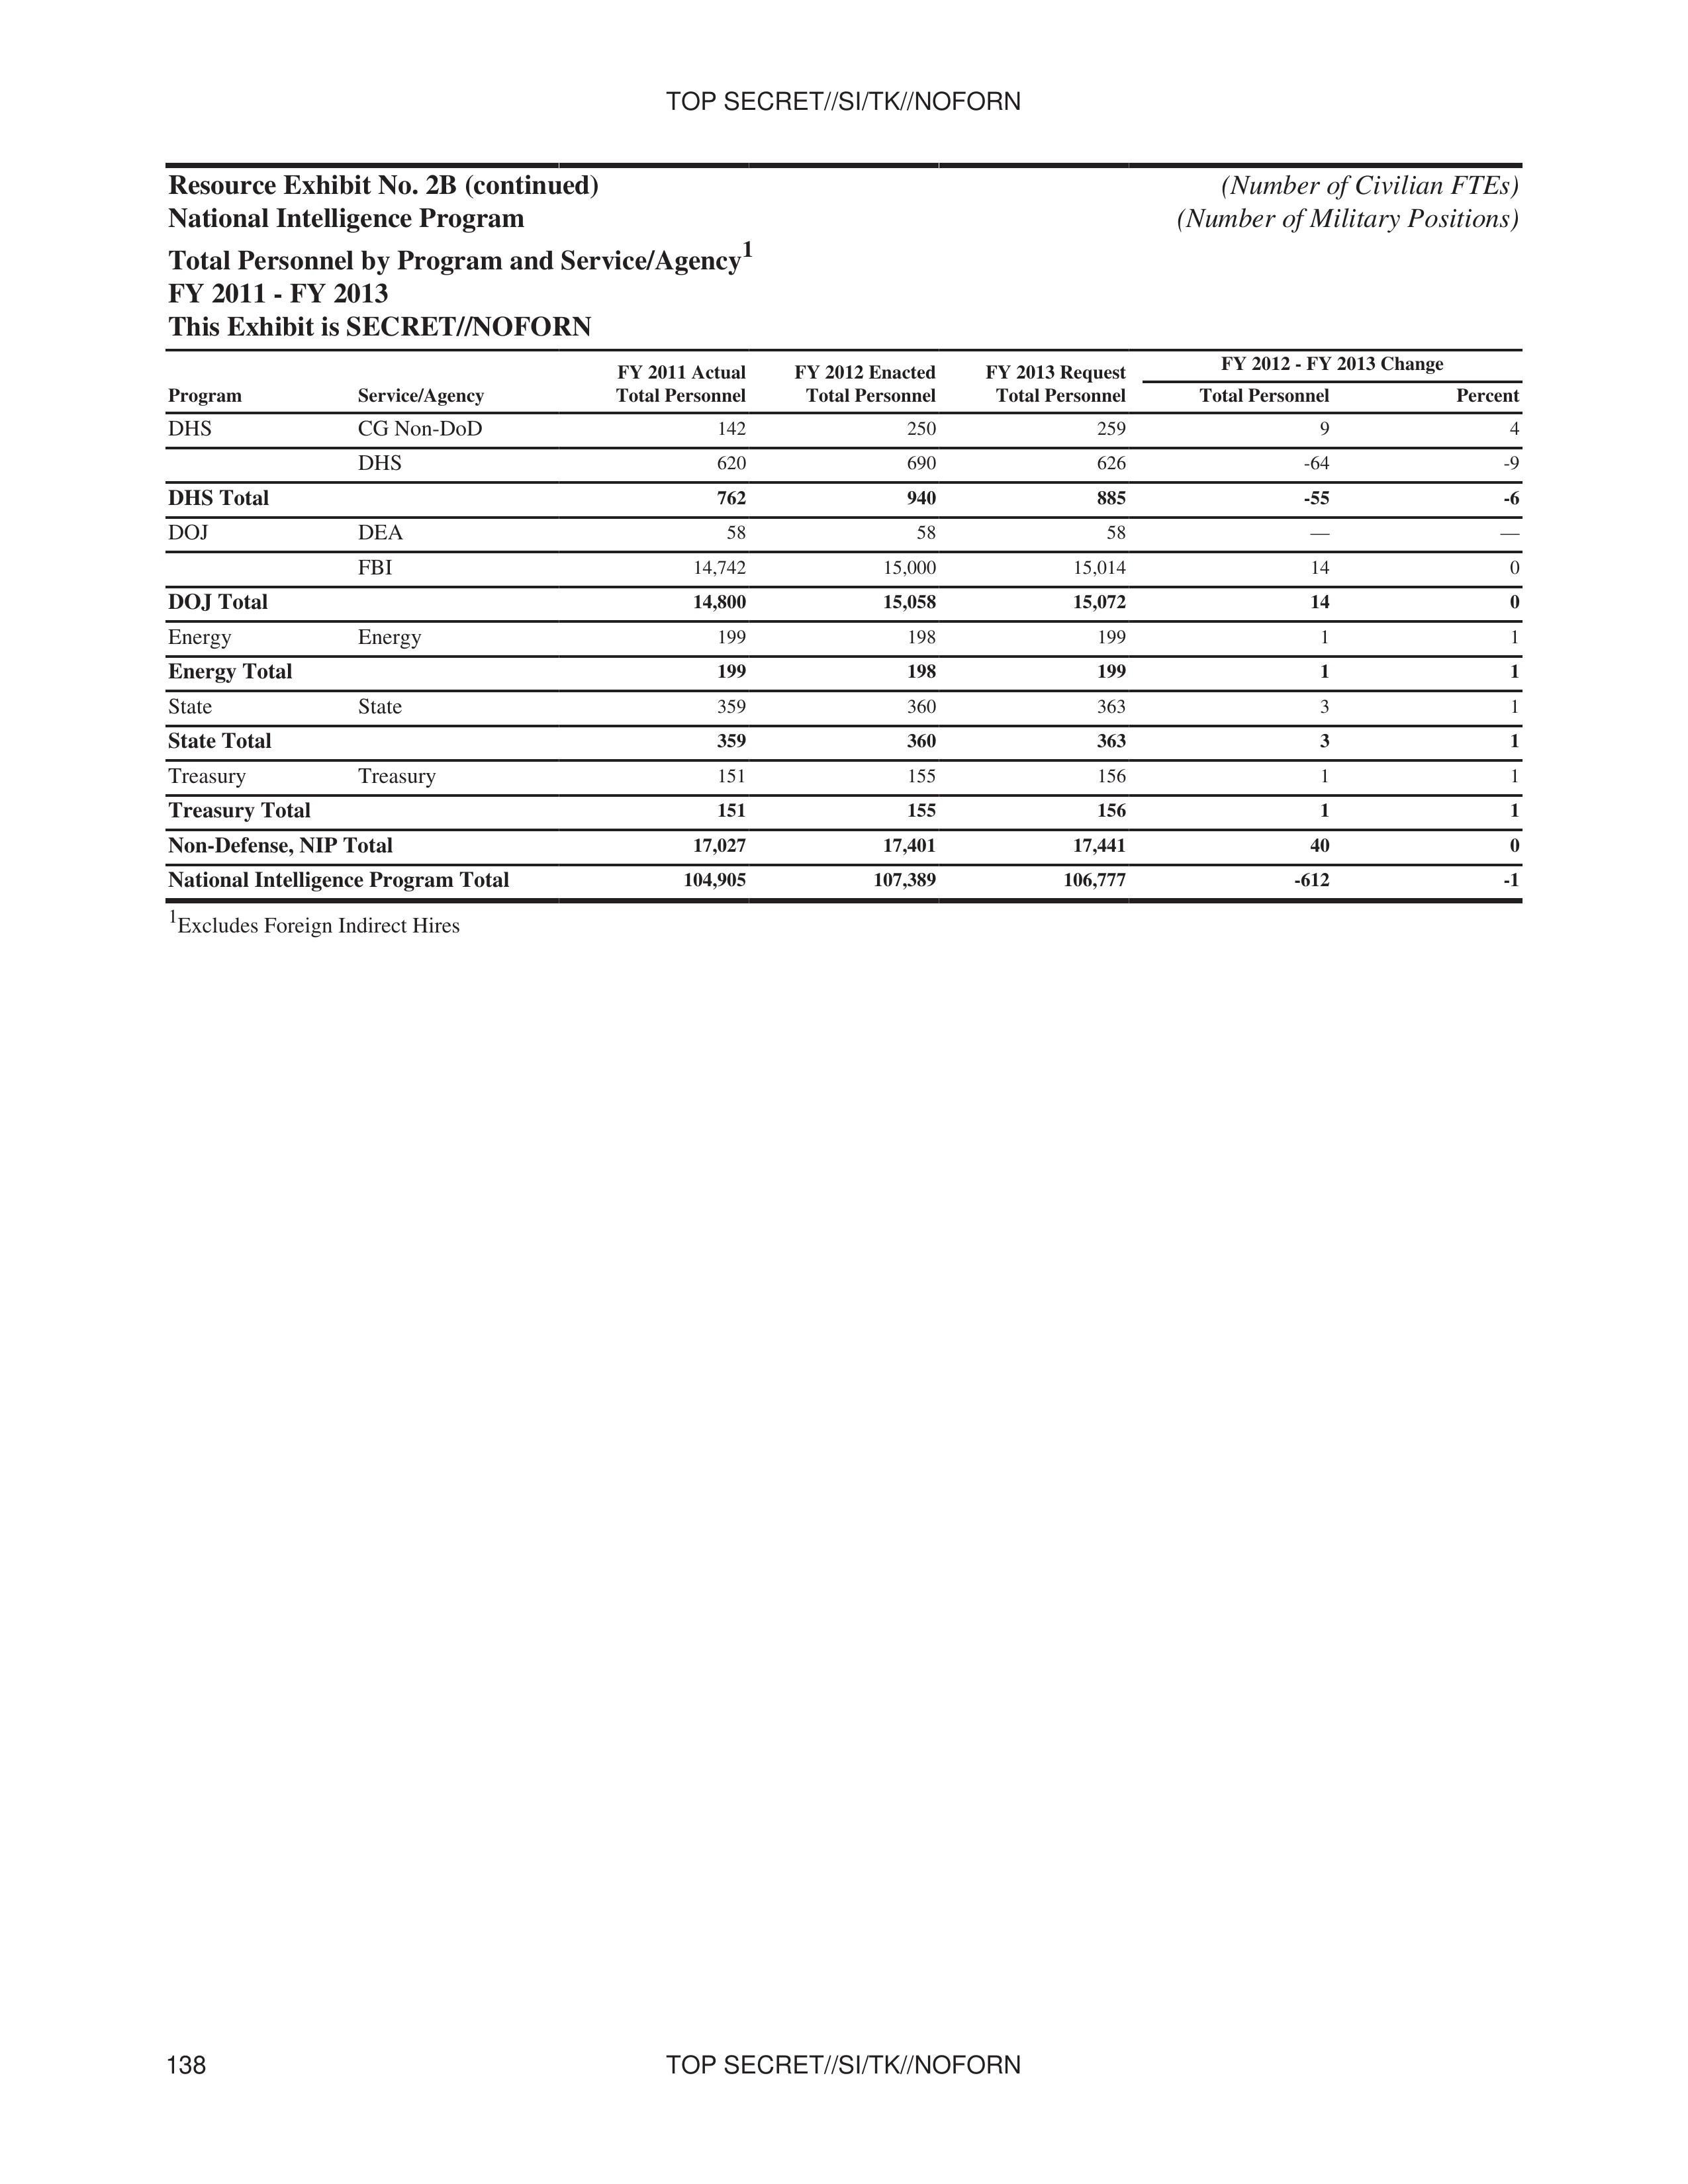
Resource Exhibit No. 2B (continued)
National Intelligence Program
Total Personnel by Program and Service/Agency¹
FY 2011 - FY 2013
This Exhibit is SECRET//NOFORN
(Number of Civilian FTEs)
(Number of Military Positions)
| Program | Service/Agency | FY 2011 Actual Total Personnel | FY 2012 Enacted Total Personnel | FY 2013 Request Total Personnel | FY 2012 - FY 2013 Change Total Personnel | FY 2012 - FY 2013 Change Percent |
|---|---|---|---|---|---|---|
| DHS | CG Non-DoD | 142 | 250 | 259 | 9 | 4 |
| DHS | 620 | 690 | 626 | -64 | -9 | |
| DHS Total | 762 | 940 | 885 | -55 | -6 | |
| DOJ | DEA | 58 | 58 | 58 | — | — |
| FBI | 14,742 | 15,000 | 15,014 | 14 | 0 | |
| DOJ Total | 14,800 | 15,058 | 15,072 | 14 | 0 | |
| Energy | Energy | 199 | 198 | 199 | 1 | 1 |
| Energy Total | 199 | 198 | 199 | 1 | 1 | |
| State | State | 359 | 360 | 363 | 3 | 1 |
| State Total | 359 | 360 | 363 | 3 | 1 | |
| Treasury | Treasury | 151 | 155 | 156 | 1 | 1 |
| Treasury Total | 151 | 155 | 156 | 1 | 1 | |
| Non-Defense, NIP Total | 17,027 | 17,401 | 17,441 | 40 | 0 | |
| National Intelligence Program Total | 104,905 | 107,389 | 106,777 | -612 | -1 |
¹ Excludes Foreign Indirect Hires
138 TOP SECRET//SI/TK//NOFORN
TOP SECRET//SI/TK//NOFORN
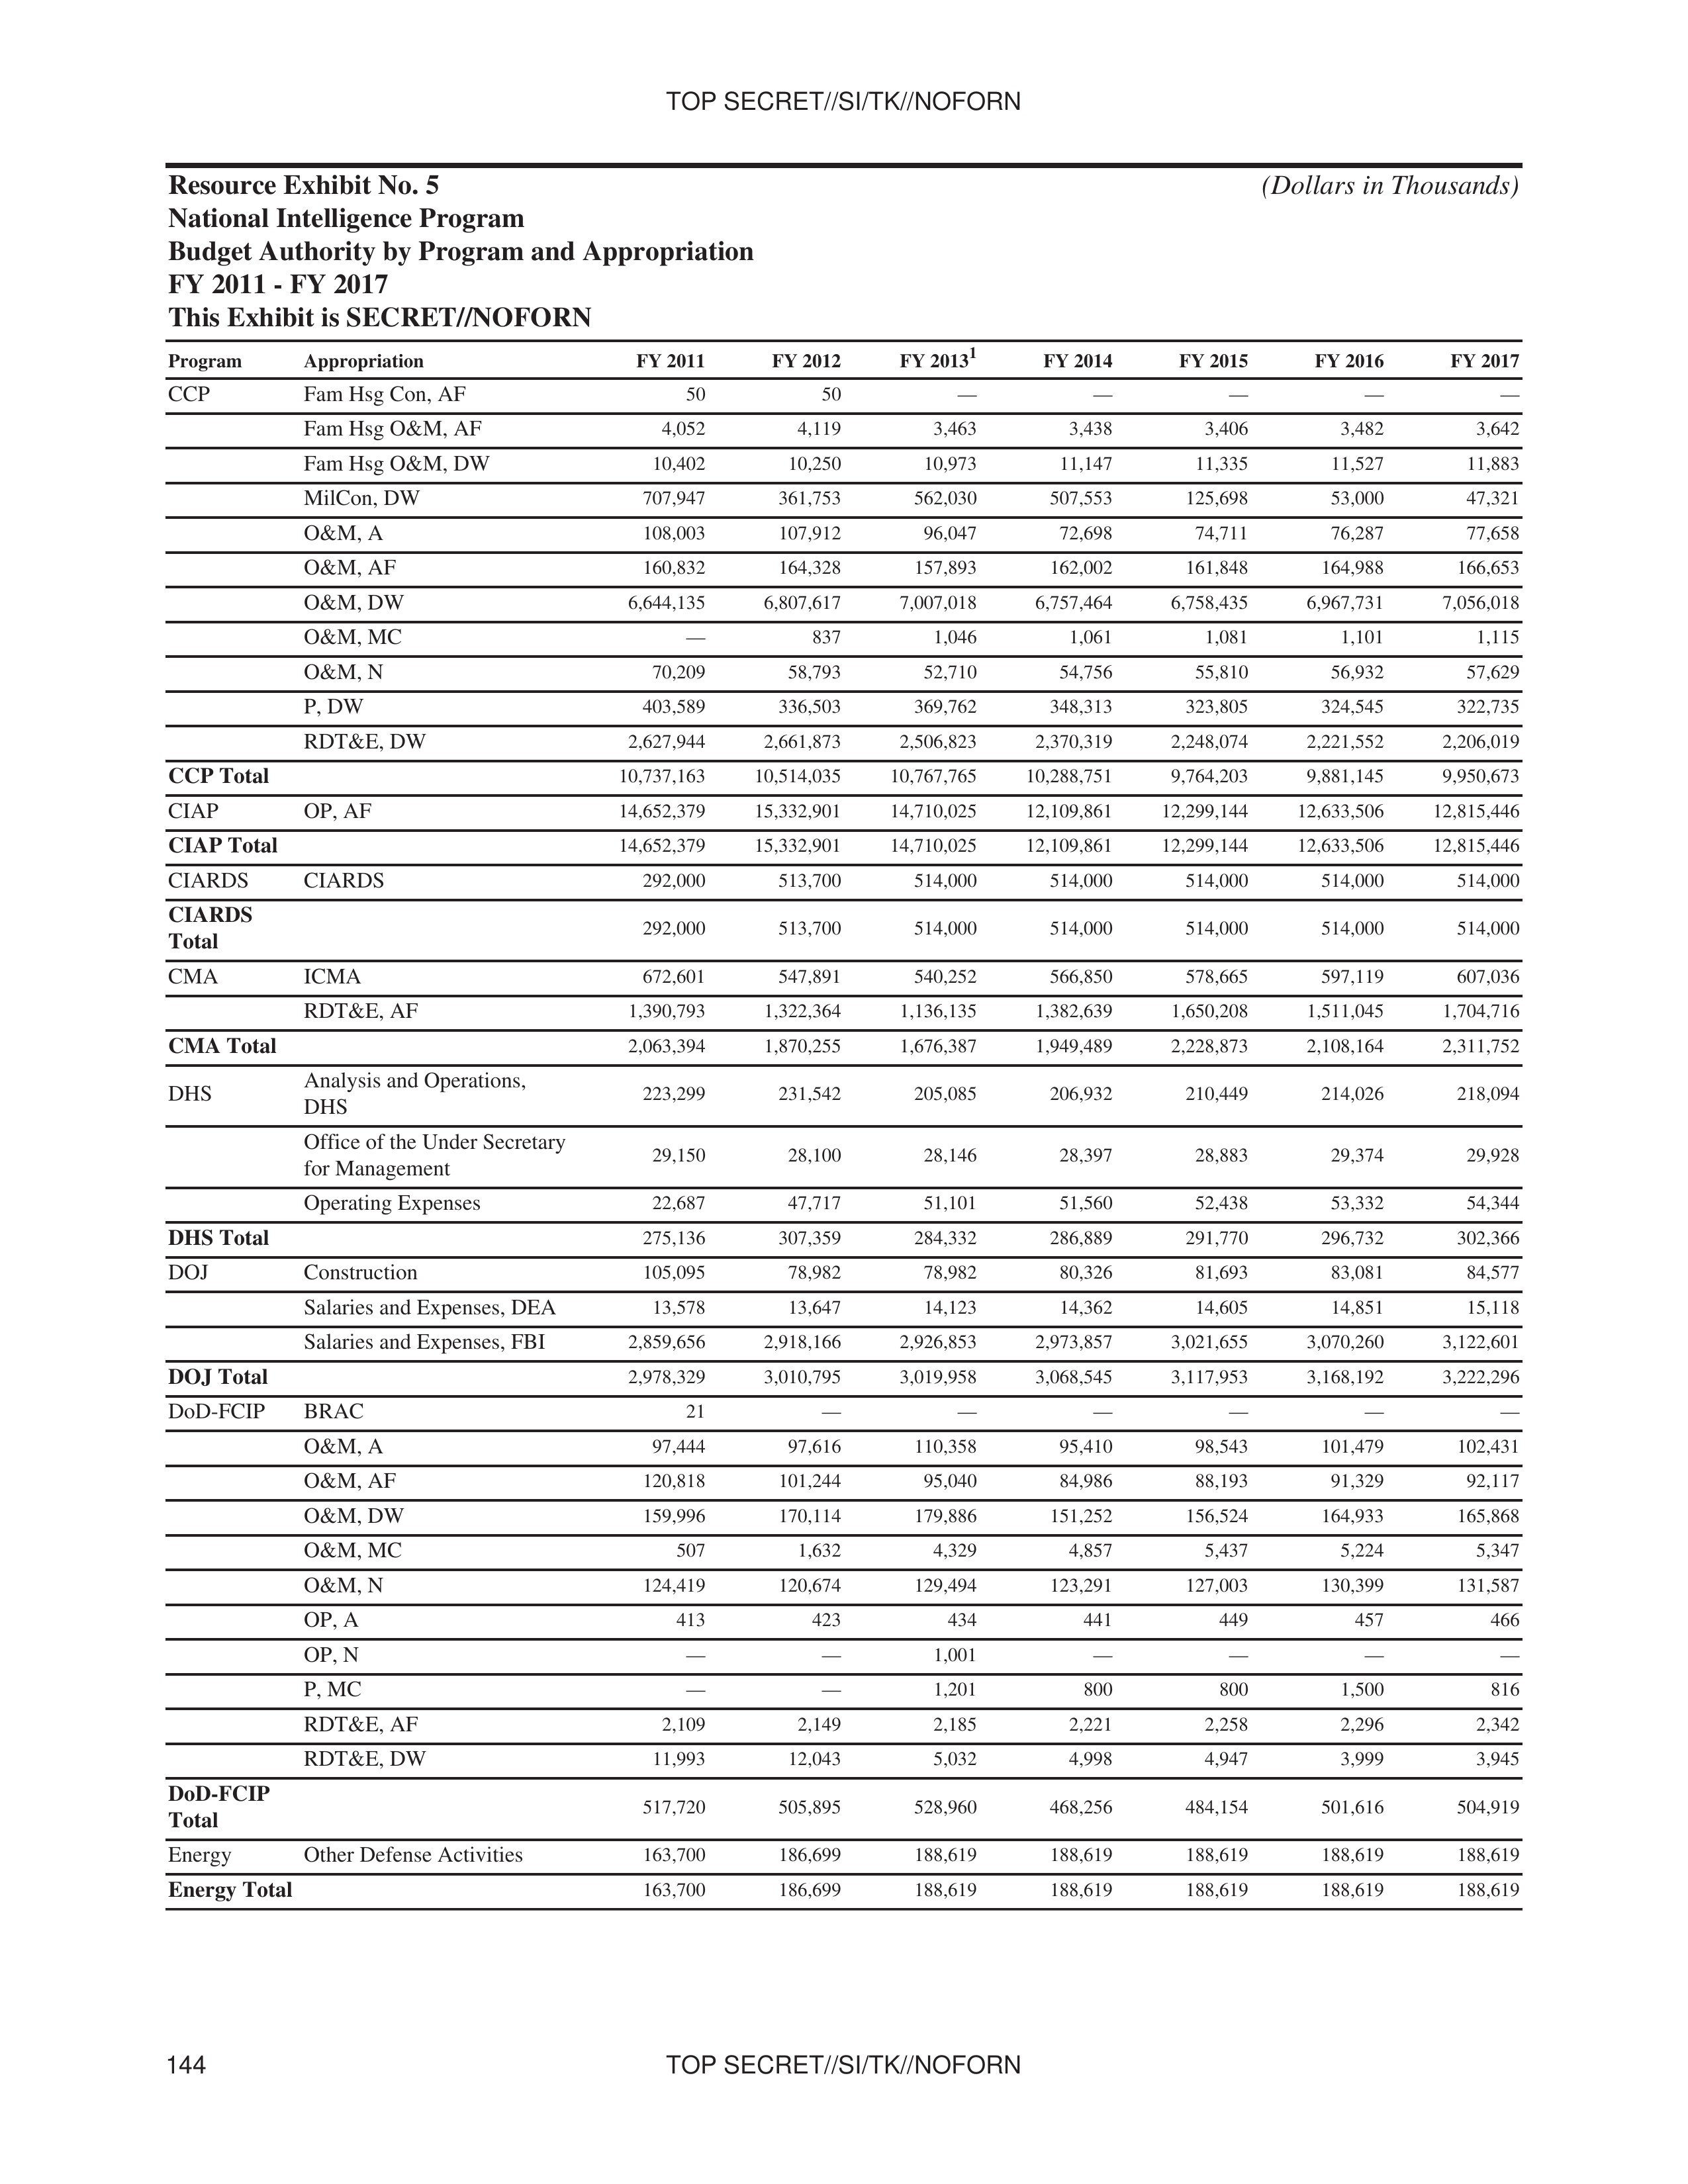
Resource Exhibit No. 5
National Intelligence Program
Budget Authority by Program and Appropriation
FY 2011 - FY 2017
This Exhibit is SECRET//NOFORN
(Dollars in Thousands)
| Program | Appropriation | FY 2011 | FY 2012 | FY 2013¹ | FY 2014 | FY 2015 | FY 2016 | FY 2017 |
|---|---|---|---|---|---|---|---|---|
| CCP | Fam Hsg Con, AF | 50 | 50 | — | — | — | — | — |
| Fam Hsg O&M, AF | 4,052 | 4,119 | 3,463 | 3,438 | 3,406 | 3,482 | 3,642 | |
| Fam Hsg O&M, DW | 10,402 | 10,250 | 10,973 | 11,147 | 11,335 | 11,527 | 11,883 | |
| MilCon, DW | 707,947 | 361,753 | 562,030 | 507,553 | 125,698 | 53,000 | 47,321 | |
| O&M, A | 108,003 | 107,912 | 96,047 | 72,698 | 74,711 | 76,287 | 77,658 | |
| O&M, AF | 160,832 | 164,328 | 157,893 | 162,002 | 161,848 | 164,988 | 166,653 | |
| O&M, DW | 6,644,135 | 6,807,617 | 7,007,018 | 6,757,464 | 6,758,435 | 6,967,731 | 7,056,018 | |
| O&M, MC | — | 837 | 1,046 | 1,061 | 1,081 | 1,101 | 1,115 | |
| O&M, N | 70,209 | 58,793 | 52,710 | 54,756 | 55,810 | 56,932 | 57,629 | |
| P, DW | 403,589 | 336,503 | 369,762 | 348,313 | 323,805 | 324,545 | 322,735 | |
| RDT&E, DW | 2,627,944 | 2,661,873 | 2,506,823 | 2,370,319 | 2,248,074 | 2,221,552 | 2,206,019 | |
| CCP Total | 10,737,163 | 10,514,035 | 10,767,765 | 10,288,751 | 9,764,203 | 9,881,145 | 9,950,673 | |
| CIAP | OP, AF | 14,652,379 | 15,332,901 | 14,710,025 | 12,109,861 | 12,299,144 | 12,633,506 | 12,815,446 |
| CIAP Total | 14,652,379 | 15,332,901 | 14,710,025 | 12,109,861 | 12,299,144 | 12,633,506 | 12,815,446 | |
| CIARDS | CIARDS | 292,000 | 513,700 | 514,000 | 514,000 | 514,000 | 514,000 | 514,000 |
| CIARDS Total | 292,000 | 513,700 | 514,000 | 514,000 | 514,000 | 514,000 | 514,000 | |
| CMA | ICMA | 672,601 | 547,891 | 540,252 | 566,850 | 578,665 | 597,119 | 607,036 |
| RDT&E, AF | 1,390,793 | 1,322,364 | 1,136,135 | 1,382,639 | 1,650,208 | 1,511,045 | 1,704,716 | |
| CMA Total | 2,063,394 | 1,870,255 | 1,676,387 | 1,949,489 | 2,228,873 | 2,108,164 | 2,311,752 | |
| DHS | Analysis and Operations, | 223,299 | 231,542 | 205,085 | 206,932 | 210,449 | 214,026 | 218,094 |
| Office of the Under Secretary | 29,150 | 28,100 | 28,146 | 28,397 | 28,883 | 29,374 | 29,928 | |
| for Management | ||||||||
| Operating Expenses | 22,687 | 47,717 | 51,101 | 51,560 | 52,438 | 53,332 | 54,344 | |
| DHS Total | 275,136 | 307,359 | 284,332 | 286,889 | 291,770 | 296,732 | 302,366 | |
| DOJ | Construction | 105,095 | 78,982 | 78,982 | 80,326 | 81,693 | 83,081 | 84,577 |
| Salaries and Expenses, DEA | 13,578 | 13,647 | 14,123 | 14,362 | 14,605 | 14,851 | 15,118 | |
| Salaries and Expenses, FBI | 2,859,656 | 2,918,166 | 2,926,853 | 2,973,857 | 3,021,655 | 3,070,260 | 3,122,601 | |
| DOJ Total | 2,978,329 | 3,010,795 | 3,019,958 | 3,068,545 | 3,117,953 | 3,168,192 | 3,222,296 | |
| DOD-FCIP | BRAC | — | — | — | 21 | — | — | — |
| O&M, A | 97,444 | 97,616 | 110,358 | 95,410 | 98,543 | 101,479 | 102,431 | |
| O&M, AF | 120,818 | 101,244 | 95,040 | 84,986 | 88,193 | 91,329 | 92,117 | |
| O&M, DW | 159,996 | 170,114 | 179,886 | 151,252 | 156,524 | 164,933 | 165,868 | |
| O&M, MC | 507 | 1,632 | 4,329 | 4,857 | 5,437 | 5,224 | 5,347 | |
| O&M, N | 124,419 | 120,674 | 129,494 | 123,291 | 127,003 | 130,399 | 131,587 | |
| OP, A | 413 | 423 | 434 | 441 | 449 | 457 | 466 | |
| OP, N | — | — | — | 1,001 | — | — | — | |
| P, MC | — | — | 1,201 | 800 | 800 | 1,500 | 816 | |
| RDT&E, AF | 2,109 | 2,149 | 2,185 | 2,221 | 2,258 | 2,296 | 2,342 | |
| RDT&E, DW | 11,993 | 12,043 | 5,032 | 4,998 | 4,947 | 3,999 | 3,945 | |
| DOD-FCIP Total | 517,720 | 505,895 | 528,960 | 468,256 | 484,154 | 501,616 | 504,919 | |
| Energy | Other Defense Activities | 163,700 | 186,699 | 188,619 | 188,619 | 188,619 | 188,619 | 188,619 |
| Energy Total | 163,700 | 186,699 | 188,619 | 188,619 | 188,619 | 188,619 | 188,619 |
144 TOP SECRET//SI/TK//NOFORN
TOP SECRET//SI/TK//NOFORN
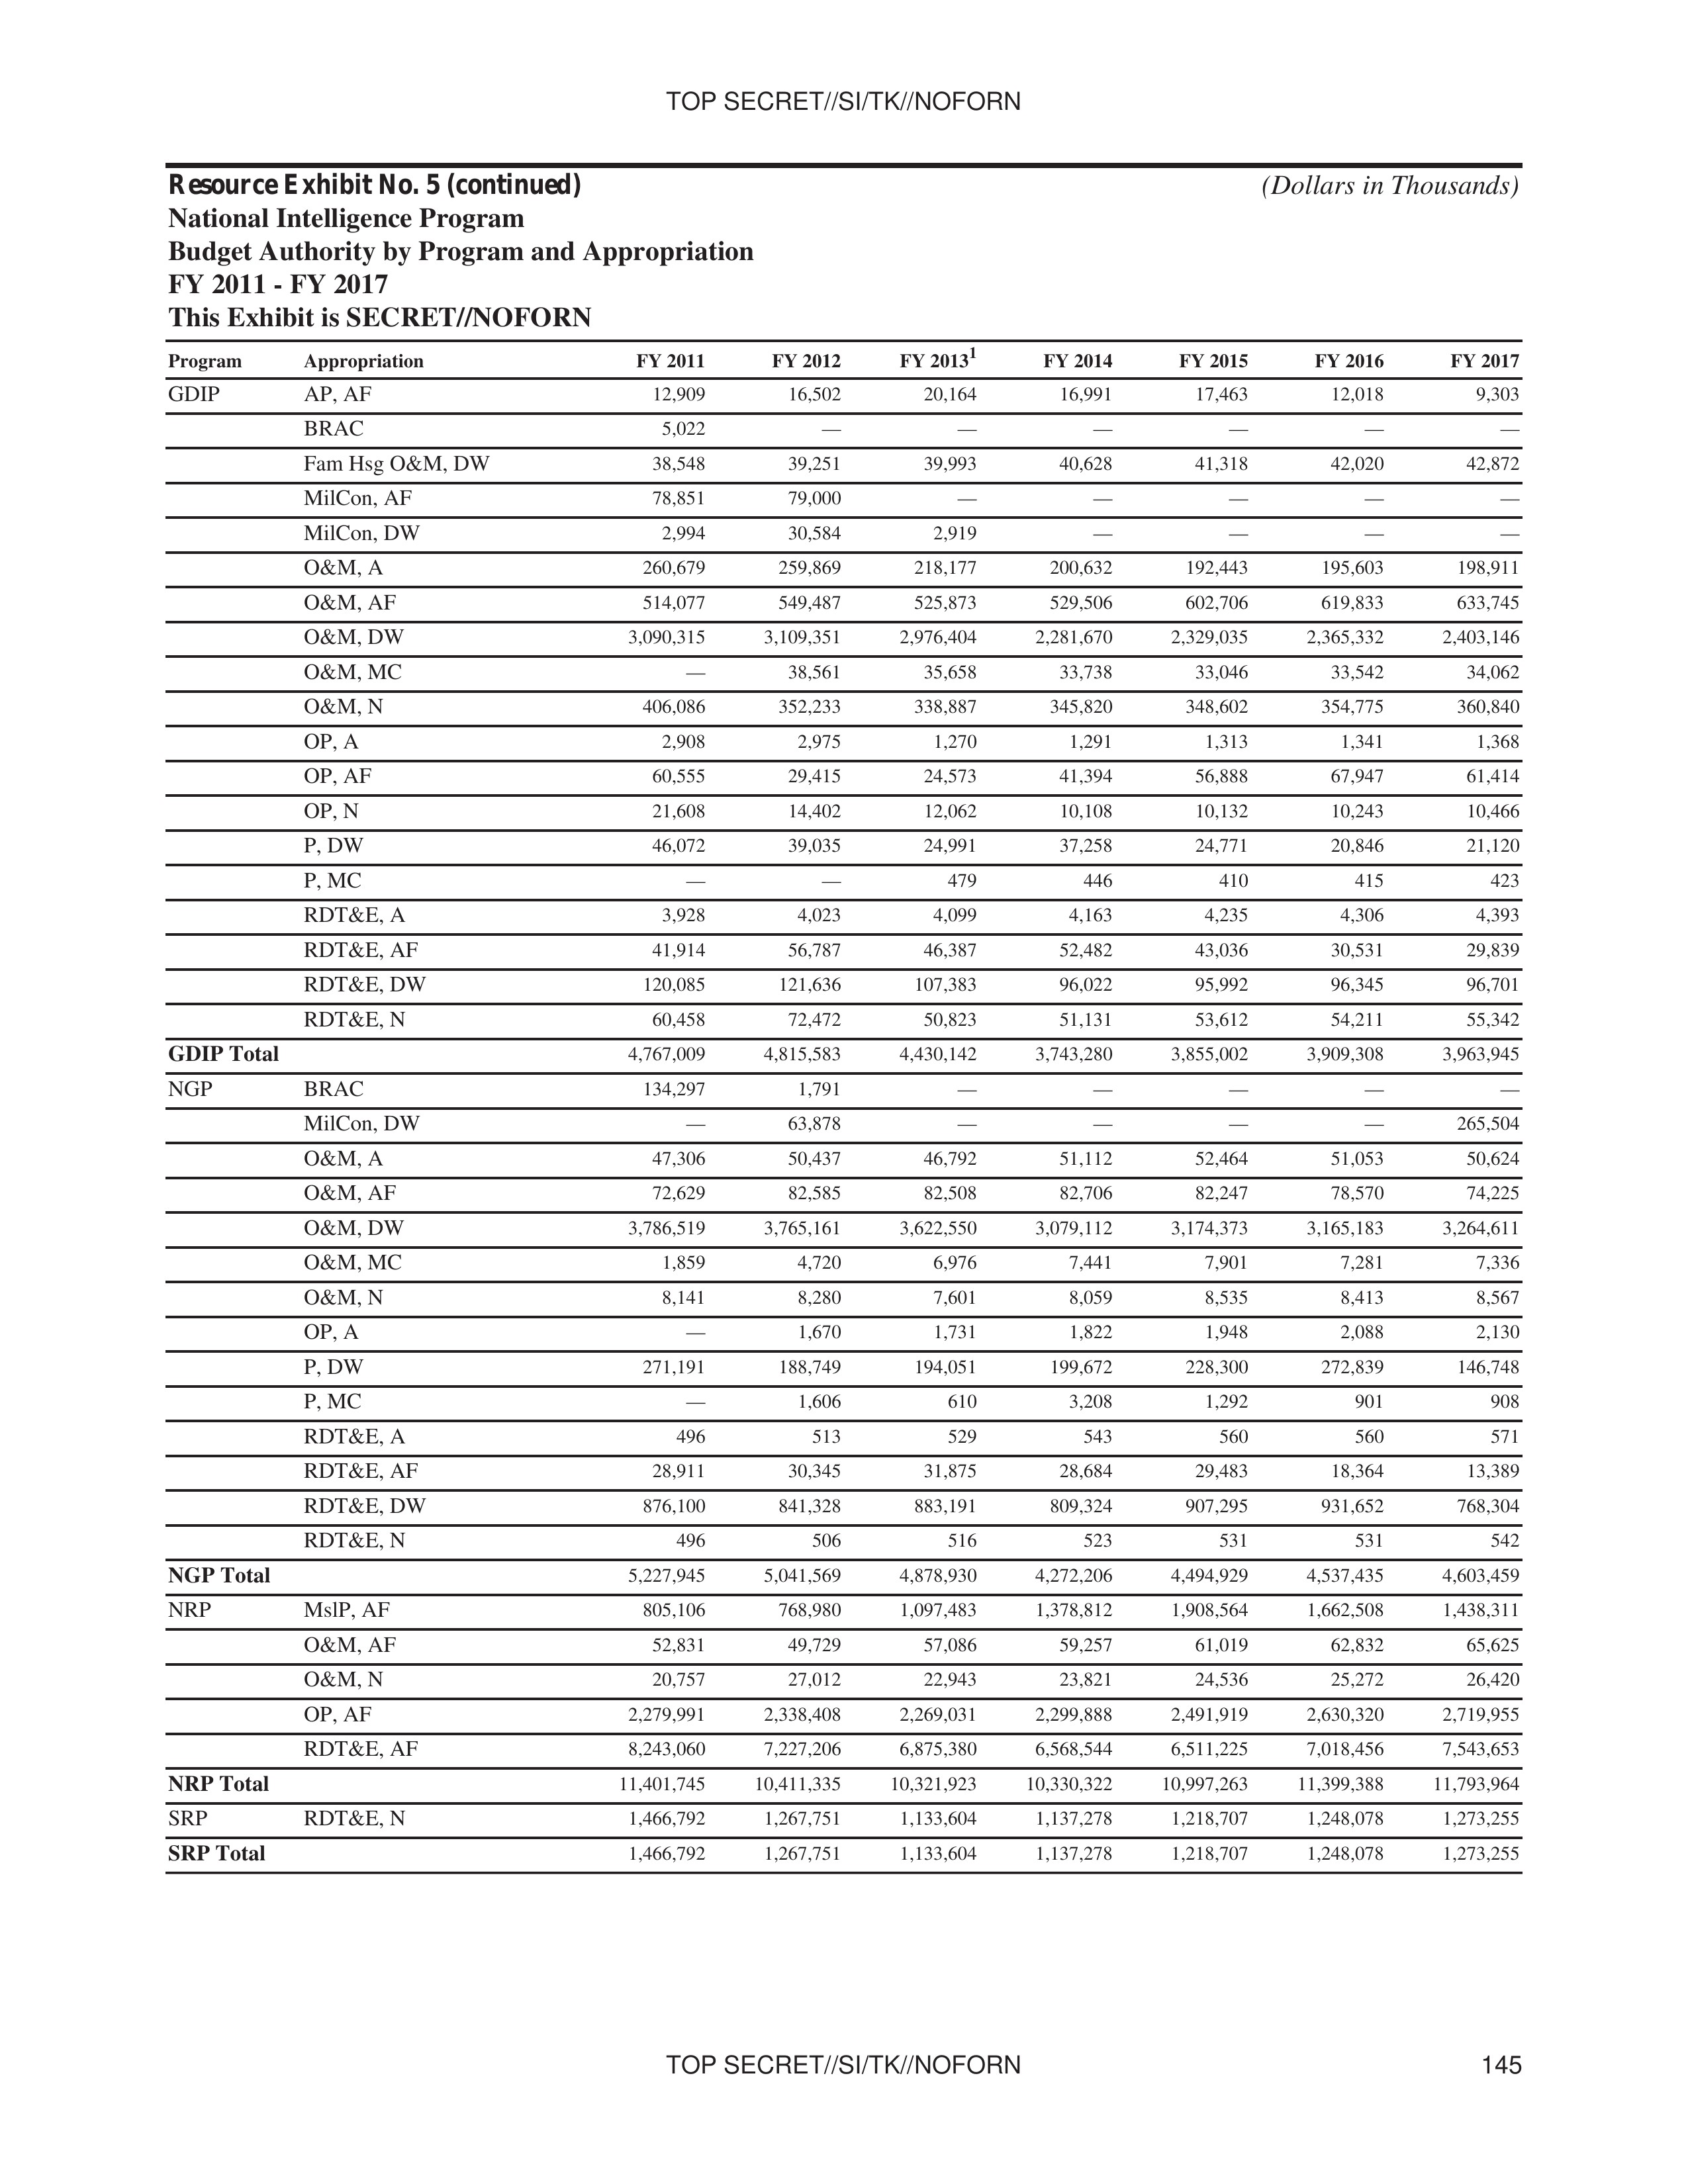
Resource Exhibit No. 5 (continued)
National Intelligence Program
Budget Authority by Program and Appropriation
FY 2011 - FY 2017
This Exhibit is SECRET//NOFORN
(Dollars in Thousands)
| Program | Appropriation | FY 2011 | FY 2012 | FY 2013¹ | FY 2014 | FY 2015 | FY 2016 | FY 2017 |
|---|---|---|---|---|---|---|---|---|
| GDIP | AP, AF | 12,909 | 16,502 | 20,164 | 16,991 | 17,463 | 12,018 | 9,303 |
| BRAC | 5,022 | — | — | — | — | — | — | |
| Fam Hsg O&M, DW | 38,548 | 39,251 | 39,993 | 40,628 | 41,318 | 42,020 | 42,872 | |
| MilCon, AF | 78,851 | 79,000 | — | — | — | — | — | |
| MilCon, DW | 2,994 | 30,584 | 2,919 | — | — | — | — | |
| O&M, A | 260,679 | 259,869 | 218,177 | 200,632 | 192,443 | 195,603 | 198,911 | |
| O&M, AF | 514,077 | 549,487 | 525,873 | 529,506 | 602,706 | 619,833 | 633,745 | |
| O&M, DW | 3,090,315 | 3,109,351 | 2,976,404 | 2,281,670 | 2,329,035 | 2,365,332 | 2,403,146 | |
| O&M, MC | — | 38,561 | 35,658 | 33,738 | 33,046 | 33,542 | 34,062 | |
| O&M, N | 406,086 | 352,233 | 338,887 | 345,820 | 348,602 | 354,775 | 360,840 | |
| OP, A | 2,908 | 2,975 | 1,270 | 1,291 | 1,313 | 1,341 | 1,368 | |
| OP, AF | 60,555 | 29,415 | 24,573 | 41,394 | 56,888 | 67,947 | 61,414 | |
| OP, N | 21,608 | 14,402 | 12,062 | 10,108 | 10,132 | 10,243 | 10,466 | |
| P, DW | 46,072 | 39,035 | 24,991 | 37,258 | 24,771 | 20,846 | 21,120 | |
| P, MC | — | — | 479 | 446 | 410 | 415 | 423 | |
| RDT&E, A | 3,928 | 4,023 | 4,099 | 4,163 | 4,235 | 4,306 | 4,393 | |
| RDT&E, AF | 41,914 | 56,787 | 46,387 | 52,482 | 43,036 | 30,531 | 29,839 | |
| RDT&E, DW | 120,085 | 121,636 | 107,383 | 96,022 | 95,992 | 96,345 | 96,701 | |
| RDT&E, N | 60,458 | 72,472 | 50,823 | 51,131 | 53,612 | 54,211 | 55,342 | |
| GDIP Total | 4,767,009 | 4,815,583 | 4,430,142 | 3,743,280 | 3,855,002 | 3,909,308 | 3,963,945 | |
| NGP | BRAC | 134,297 | — | 1,791 | — | — | — | — |
| MilCon, DW | — | 63,878 | — | — | — | — | 265,504 | |
| O&M, A | 47,306 | 50,437 | 46,792 | 51,112 | 52,464 | 51,053 | 50,624 | |
| O&M, AF | 72,629 | 82,585 | 82,508 | 82,706 | 82,247 | 78,570 | 74,225 | |
| O&M, DW | 3,786,519 | 3,765,161 | 3,622,550 | 3,079,112 | 3,174,373 | 3,165,183 | 3,264,611 | |
| O&M, MC | 1,859 | 4,720 | 6,976 | 7,441 | 7,901 | 7,281 | 7,336 | |
| O&M, N | 8,141 | 8,280 | 7,601 | 8,059 | 8,535 | 8,413 | 8,567 | |
| OP, A | — | 1,670 | 1,731 | 1,822 | 1,948 | 2,088 | 2,130 | |
| P, DW | 271,191 | 188,749 | 194,051 | 199,672 | 228,300 | 272,839 | 146,748 | |
| P, MC | — | 1,606 | 610 | 3,208 | 1,292 | 901 | 908 | |
| RDT&E, A | 496 | 513 | 529 | 543 | 560 | 560 | 571 | |
| RDT&E, AF | 28,911 | 30,345 | 31,875 | 28,684 | 29,483 | 18,364 | 13,389 | |
| RDT&E, DW | 876,100 | 841,328 | 883,191 | 809,324 | 907,295 | 931,652 | 768,304 | |
| RDT&E, N | 496 | 506 | 516 | 523 | 531 | 531 | 542 | |
| NGP Total | 5,227,945 | 5,041,569 | 4,878,930 | 4,272,206 | 4,494,929 | 4,537,435 | 4,603,459 | |
| NRP | MsIP, AF | 805,106 | 768,980 | 1,097,483 | 1,378,812 | 1,908,564 | 1,662,508 | 1,438,311 |
| O&M, AF | 52,831 | 49,729 | 57,086 | 59,257 | 61,019 | 62,832 | 65,625 | |
| O&M, N | 20,757 | 27,012 | 22,943 | 23,821 | 24,536 | 25,272 | 26,420 | |
| OP, AF | 2,279,991 | 2,338,408 | 2,269,031 | 2,299,888 | 2,491,919 | 2,630,320 | 2,719,955 | |
| RDT&E, AF | 8,243,060 | 7,227,206 | 6,875,380 | 6,568,544 | 6,511,225 | 7,018,456 | 7,543,653 | |
| NRP Total | 11,401,745 | 10,411,335 | 10,321,923 | 10,330,322 | 10,997,263 | 11,399,388 | 11,793,964 | |
| SRP | RDT&E, N | 1,466,792 | 1,267,751 | 1,133,604 | 1,137,278 | 1,218,707 | 1,248,078 | 1,273,255 |
| SRP Total | 1,466,792 | 1,267,751 | 1,133,604 | 1,137,278 | 1,218,707 | 1,248,078 | 1,273,255 |
TOP SECRET//SI/TK//NOFORN 145
TOP SECRET//SI/TK//NOFORN
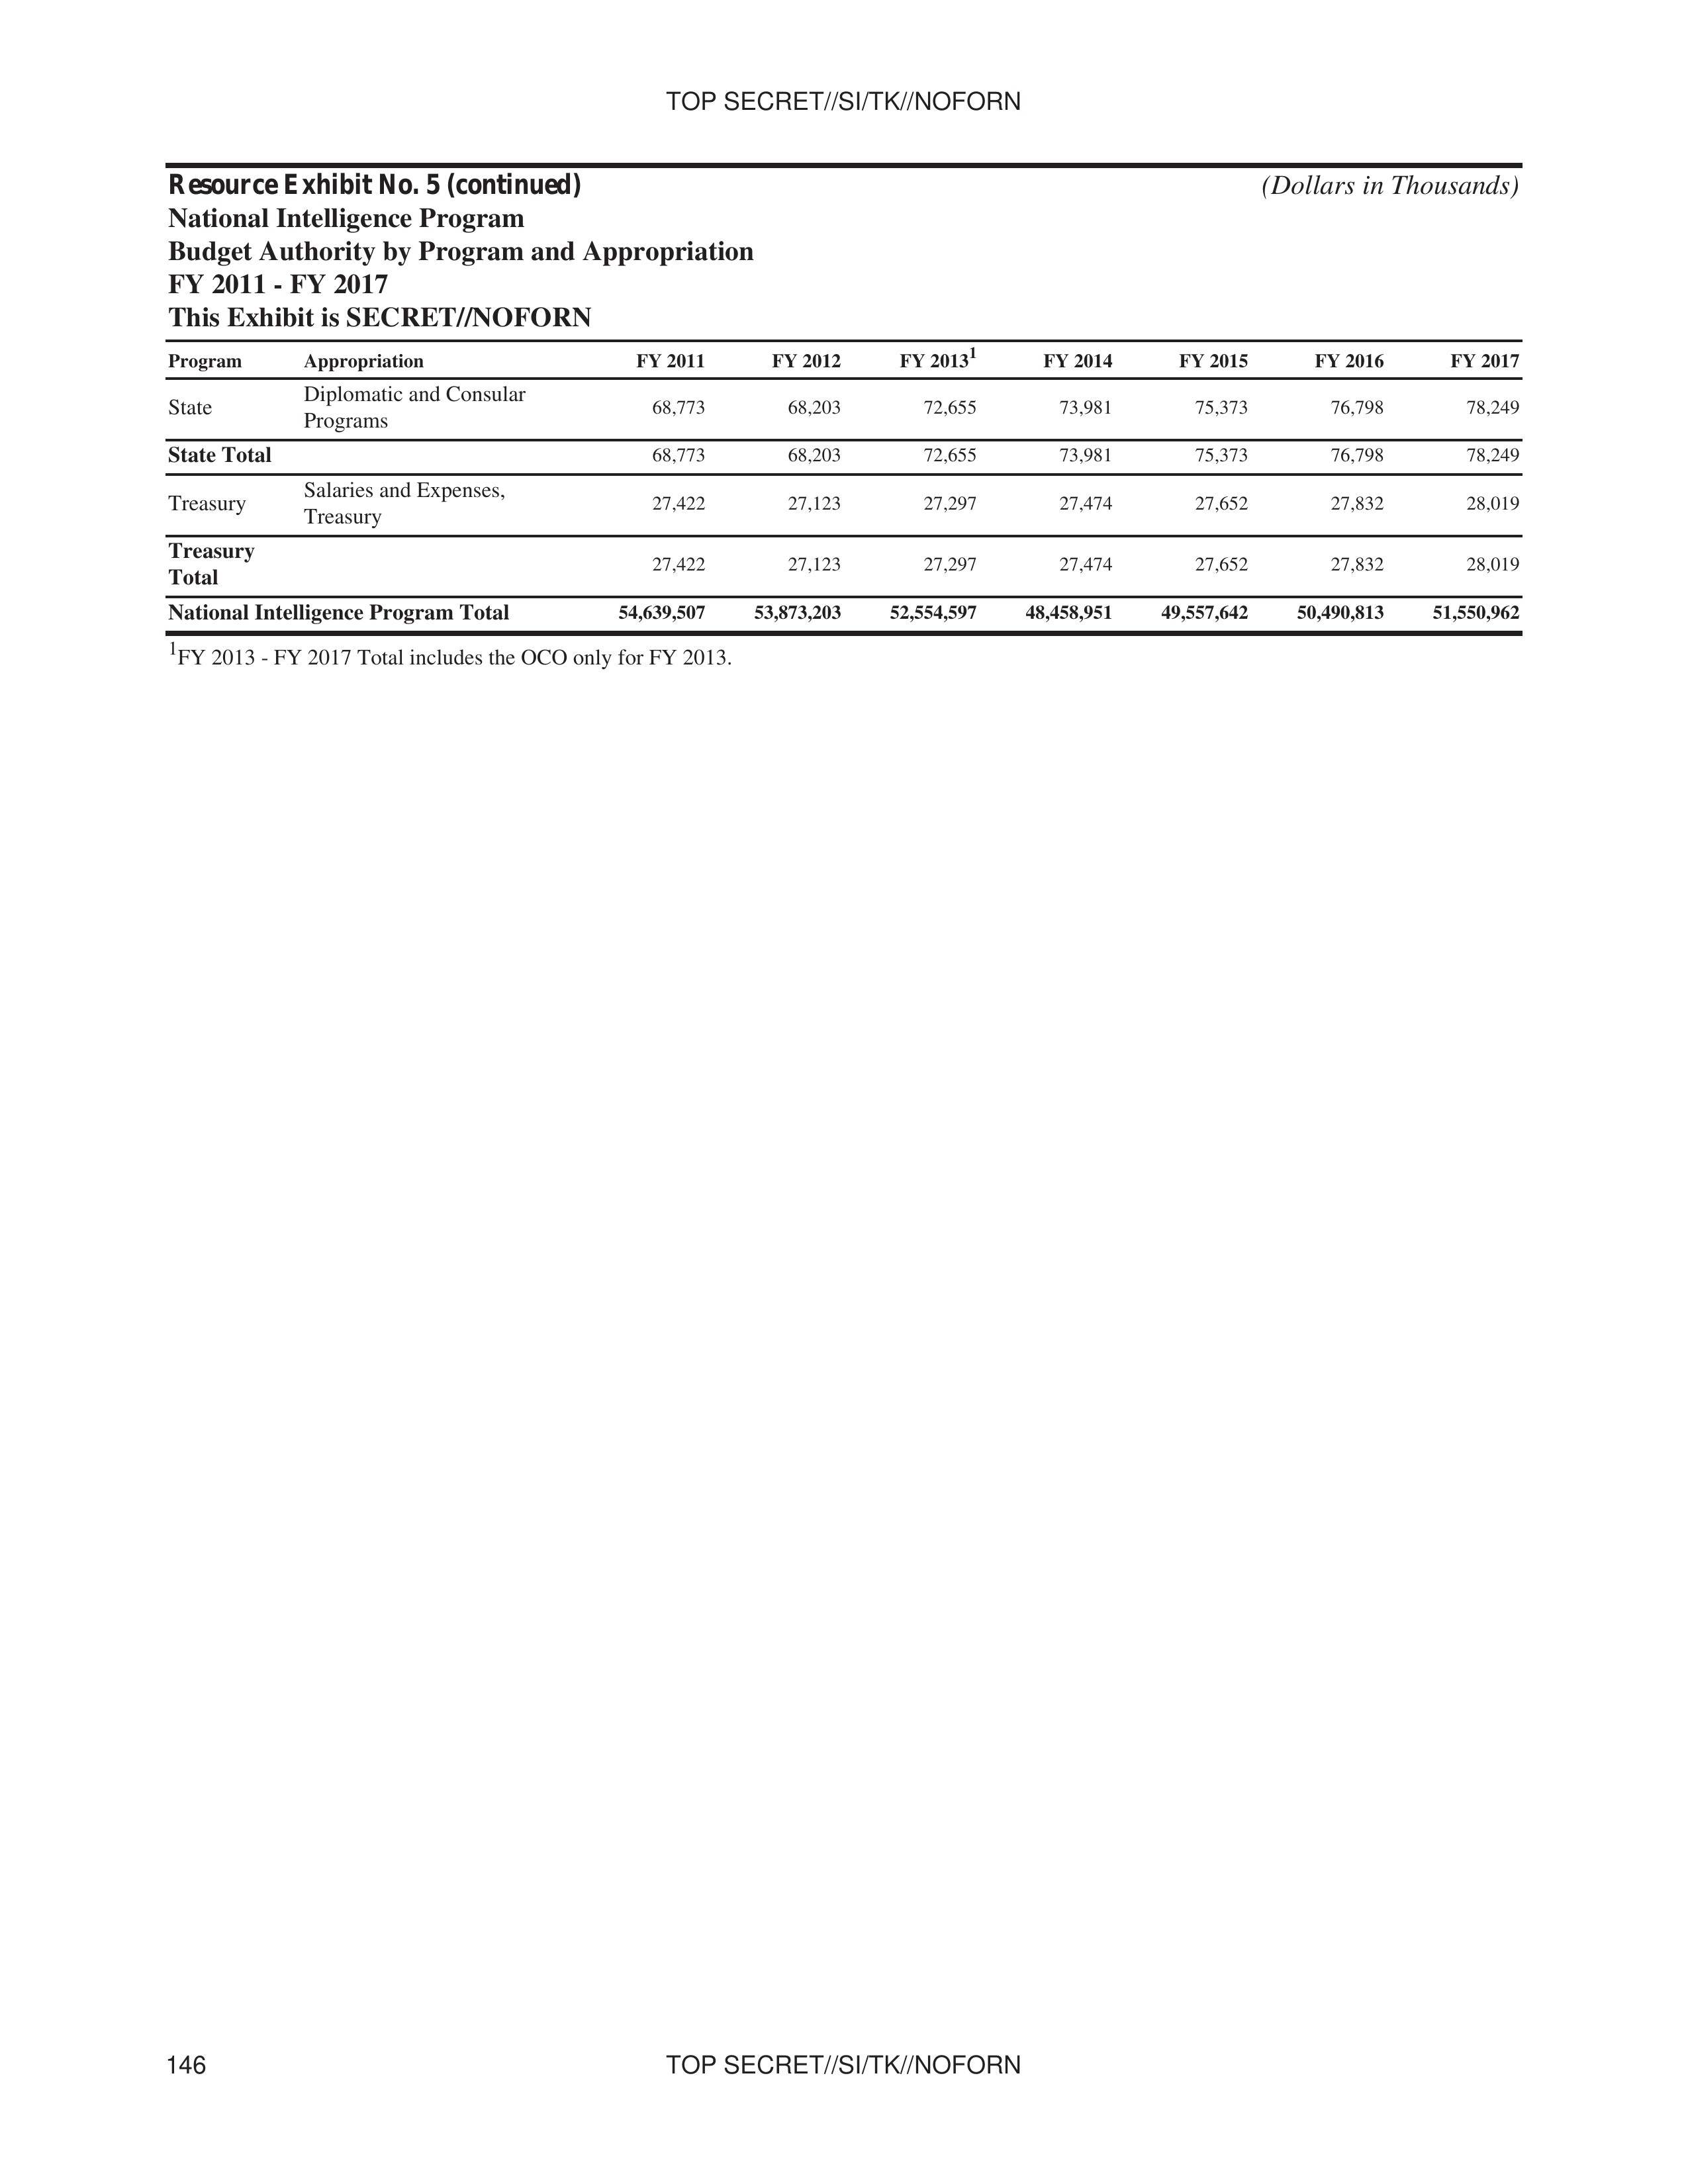
Resource Exhibit No. 5 (continued)
National Intelligence Program
Budget Authority by Program and Appropriation
FY 2011 - FY 2017
This Exhibit is SECRET//NOFORN
(Dollars in Thousands)
| Program | Appropriation | FY 2011 | FY 2012 | FY 2013¹ | FY 2014 | FY 2015 | FY 2016 | FY 2017 |
|---|---|---|---|---|---|---|---|---|
| State | Diplomatic and Consular Programs | 68,773 | 68,203 | 72,655 | 73,981 | 75,373 | 76,798 | 78,249 |
| State Total | 68,773 | 68,203 | 72,655 | 73,981 | 75,373 | 76,798 | 78,249 | |
| Treasury | Salaries and Expenses, Treasury | 27,422 | 27,123 | 27,297 | 27,474 | 27,652 | 27,832 | 28,019 |
| Treasury Total | 27,422 | 27,123 | 27,297 | 27,474 | 27,652 | 27,832 | 28,019 | |
| National Intelligence Program Total | 54,639,507 | 53,873,203 | 52,554,597 | 48,458,951 | 49,557,642 | 50,490,813 | 51,550,962 |
¹FY 2013 - FY 2017 Total includes the OCO only for FY 2013.
146 TOP SECRET//SI/TK//NOFORN
TOP SECRET//SI/TK//NOFORN
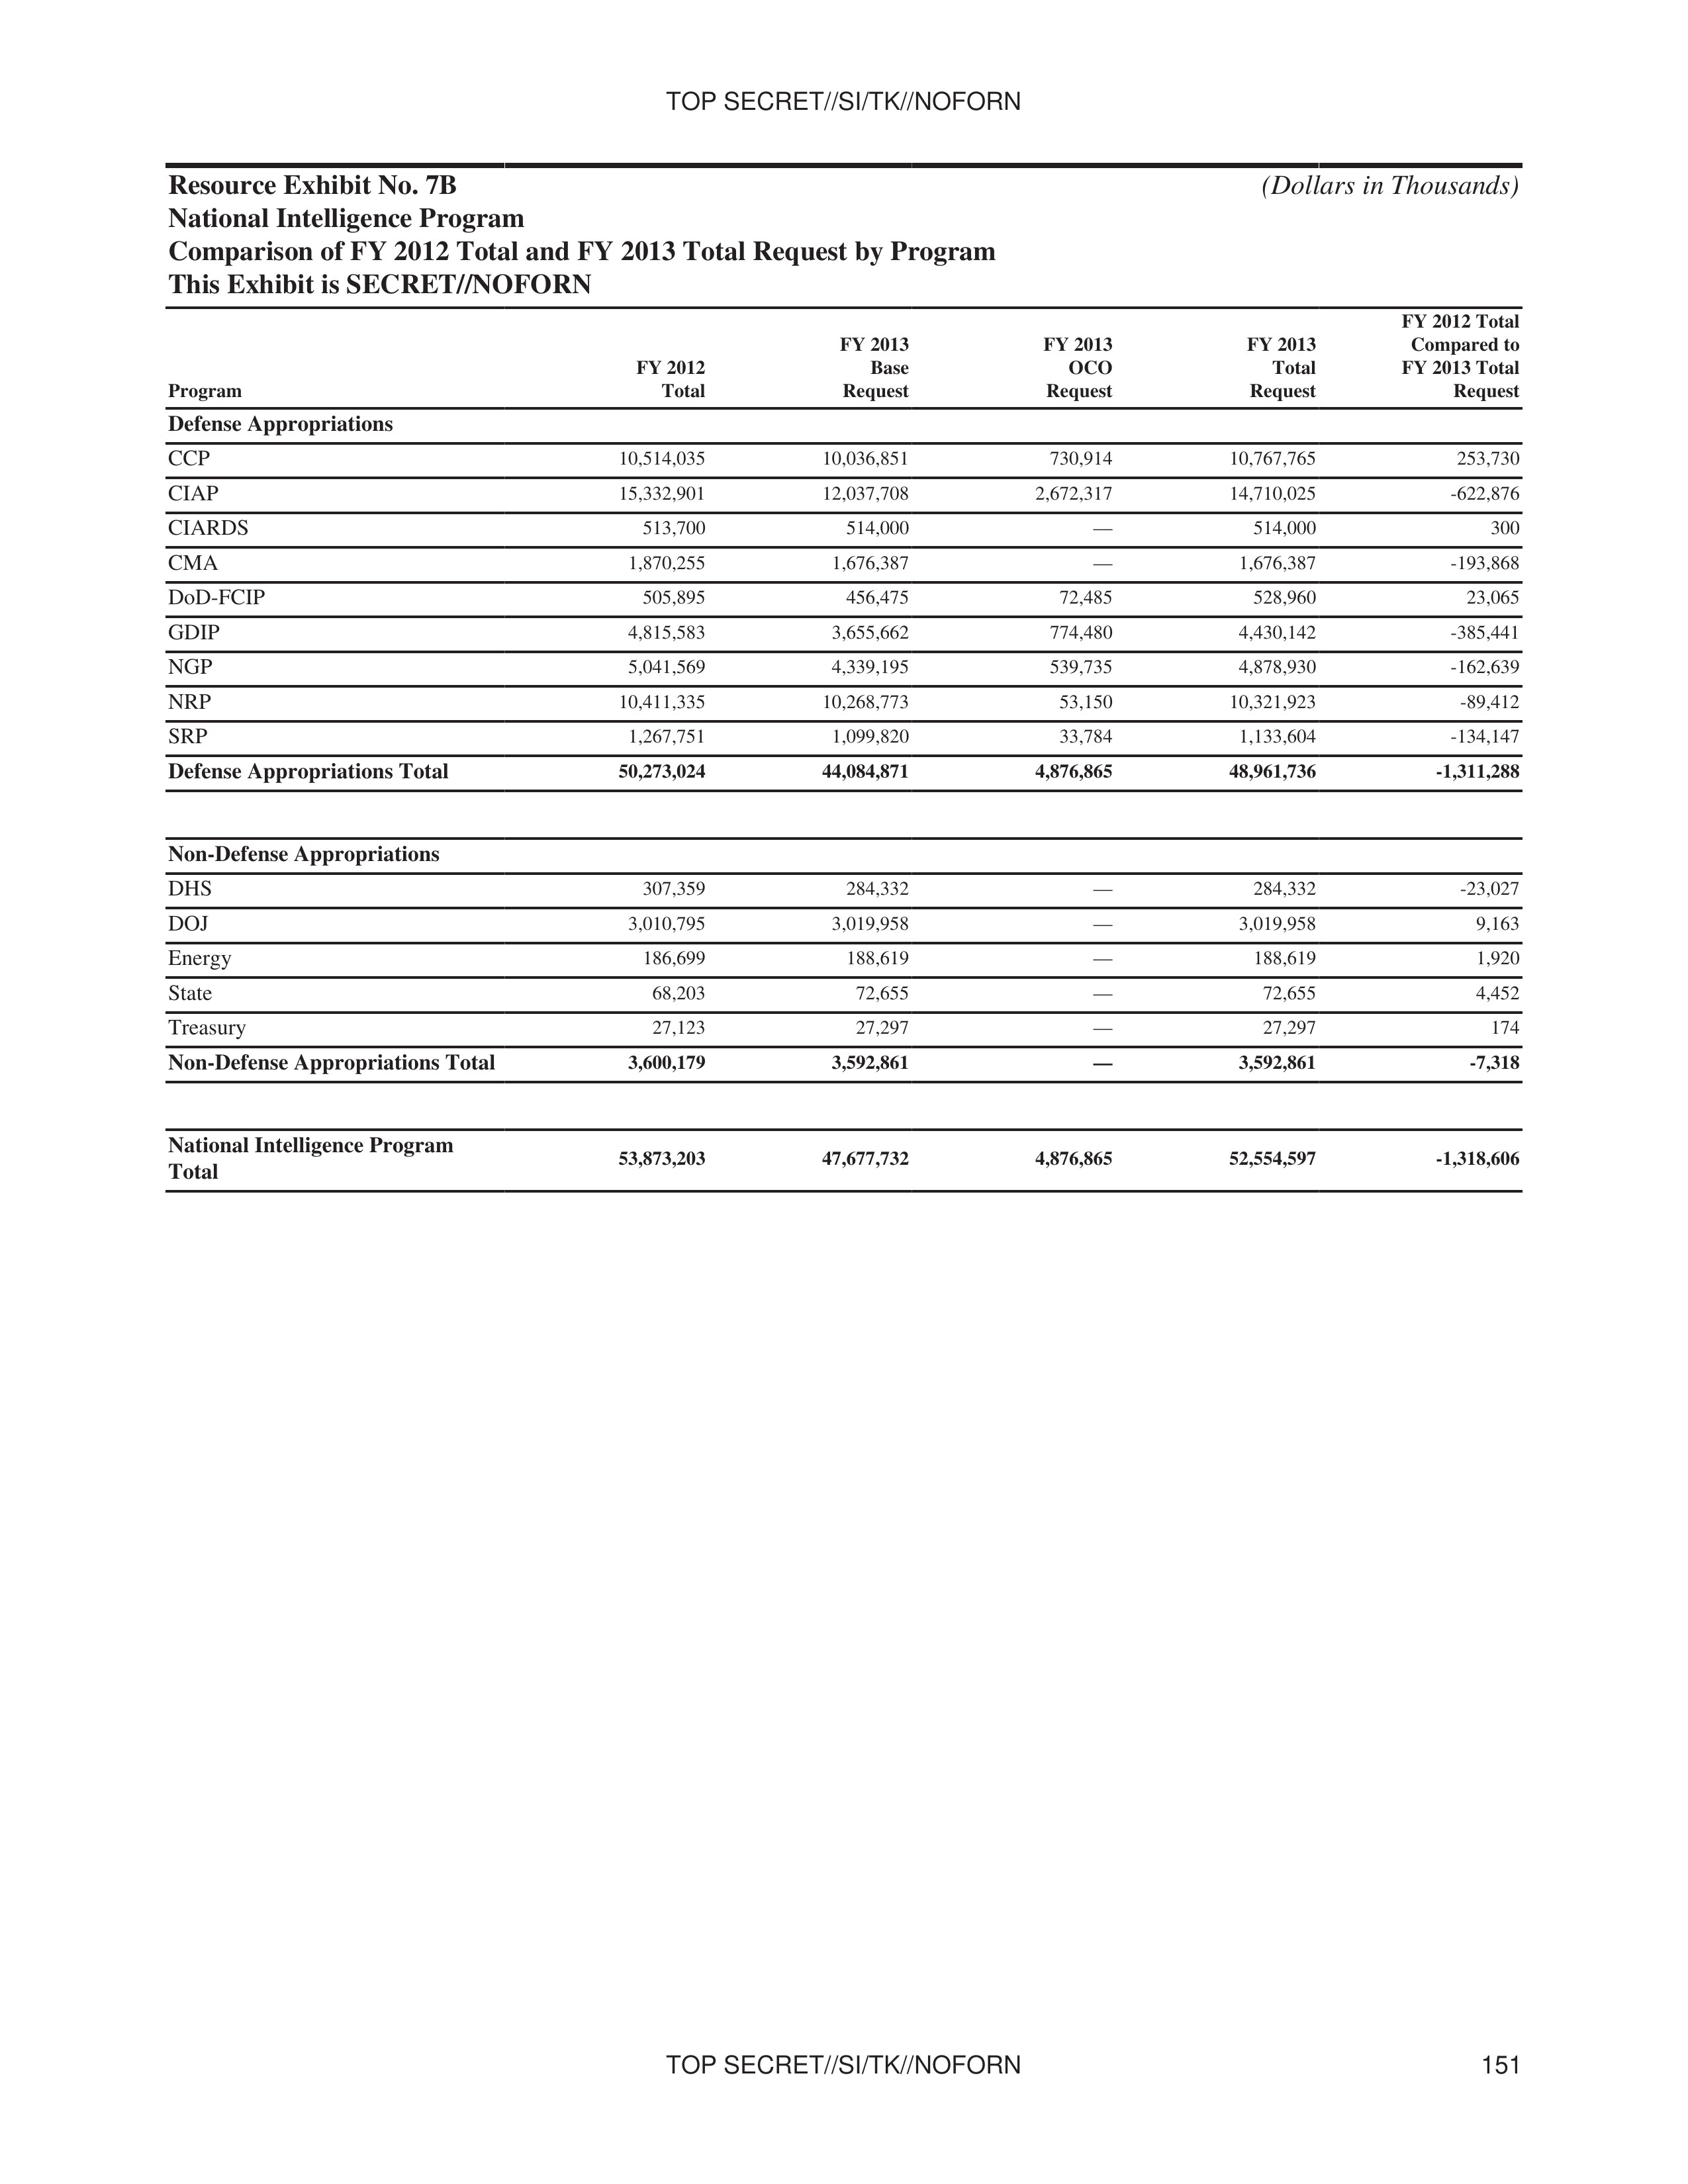
Resource Exhibit No. 7B
National Intelligence Program
Comparison of FY 2012 Total and FY 2013 Total Request by Program
This Exhibit is SECRET//NOFORN
(Dollars in Thousands)
| Program | FY 2012 Total Request | FY 2013 Base | FY 2013 OCO | FY 2013 Total Request | FY 2012 Total Compared to FY 2013 Total Request |
|---|---|---|---|---|---|
| Defense Appropriations | |||||
| CCP | 10,514,035 | 10,036,851 | 730,914 | 10,767,765 | 253,730 |
| CIAP | 15,332,901 | 12,037,708 | 2,672,317 | 14,710,025 | -622,876 |
| CIARDS | 513,700 | 514,000 | — | 514,000 | 300 |
| CMA | 1,870,255 | 1,676,387 | — | 1,676,387 | -193,868 |
| DOD-FCIP | 505,895 | 456,475 | 72,485 | 528,960 | 23,065 |
| GDIP | 4,815,583 | 3,655,662 | 774,480 | 4,430,142 | -385,441 |
| NGP | 5,041,569 | 4,339,195 | 539,735 | 4,878,930 | -162,639 |
| NRP | 10,411,335 | 10,268,773 | 53,150 | 10,321,923 | -89,412 |
| SRP | 1,267,751 | 1,099,820 | 33,784 | 1,133,604 | -134,147 |
| Defense Appropriations Total | 50,273,024 | 44,084,871 | 4,876,865 | 48,961,736 | -1,311,288 |
| Non-Defense Appropriations | |||||
| DHS | 307,359 | 284,332 | — | 284,332 | -23,027 |
| DOJ | 3,010,795 | 3,019,958 | — | 3,019,958 | 9,163 |
| Energy | 186,699 | 188,619 | — | 188,619 | 1,920 |
| State | 68,203 | 72,655 | — | 72,655 | 4,452 |
| Treasury | 27,123 | 27,297 | — | 27,297 | 174 |
| Non-Defense Appropriations Total | 3,600,179 | 3,592,861 | — | 3,592,861 | -7,318 |
| National Intelligence Program Total | 53,873,203 | 47,677,732 | 4,876,865 | 52,554,597 | -1,318,606 |
TOP SECRET//SI/TK//NOFORN 151
TOP SECRET//SI/TK//NOFORN
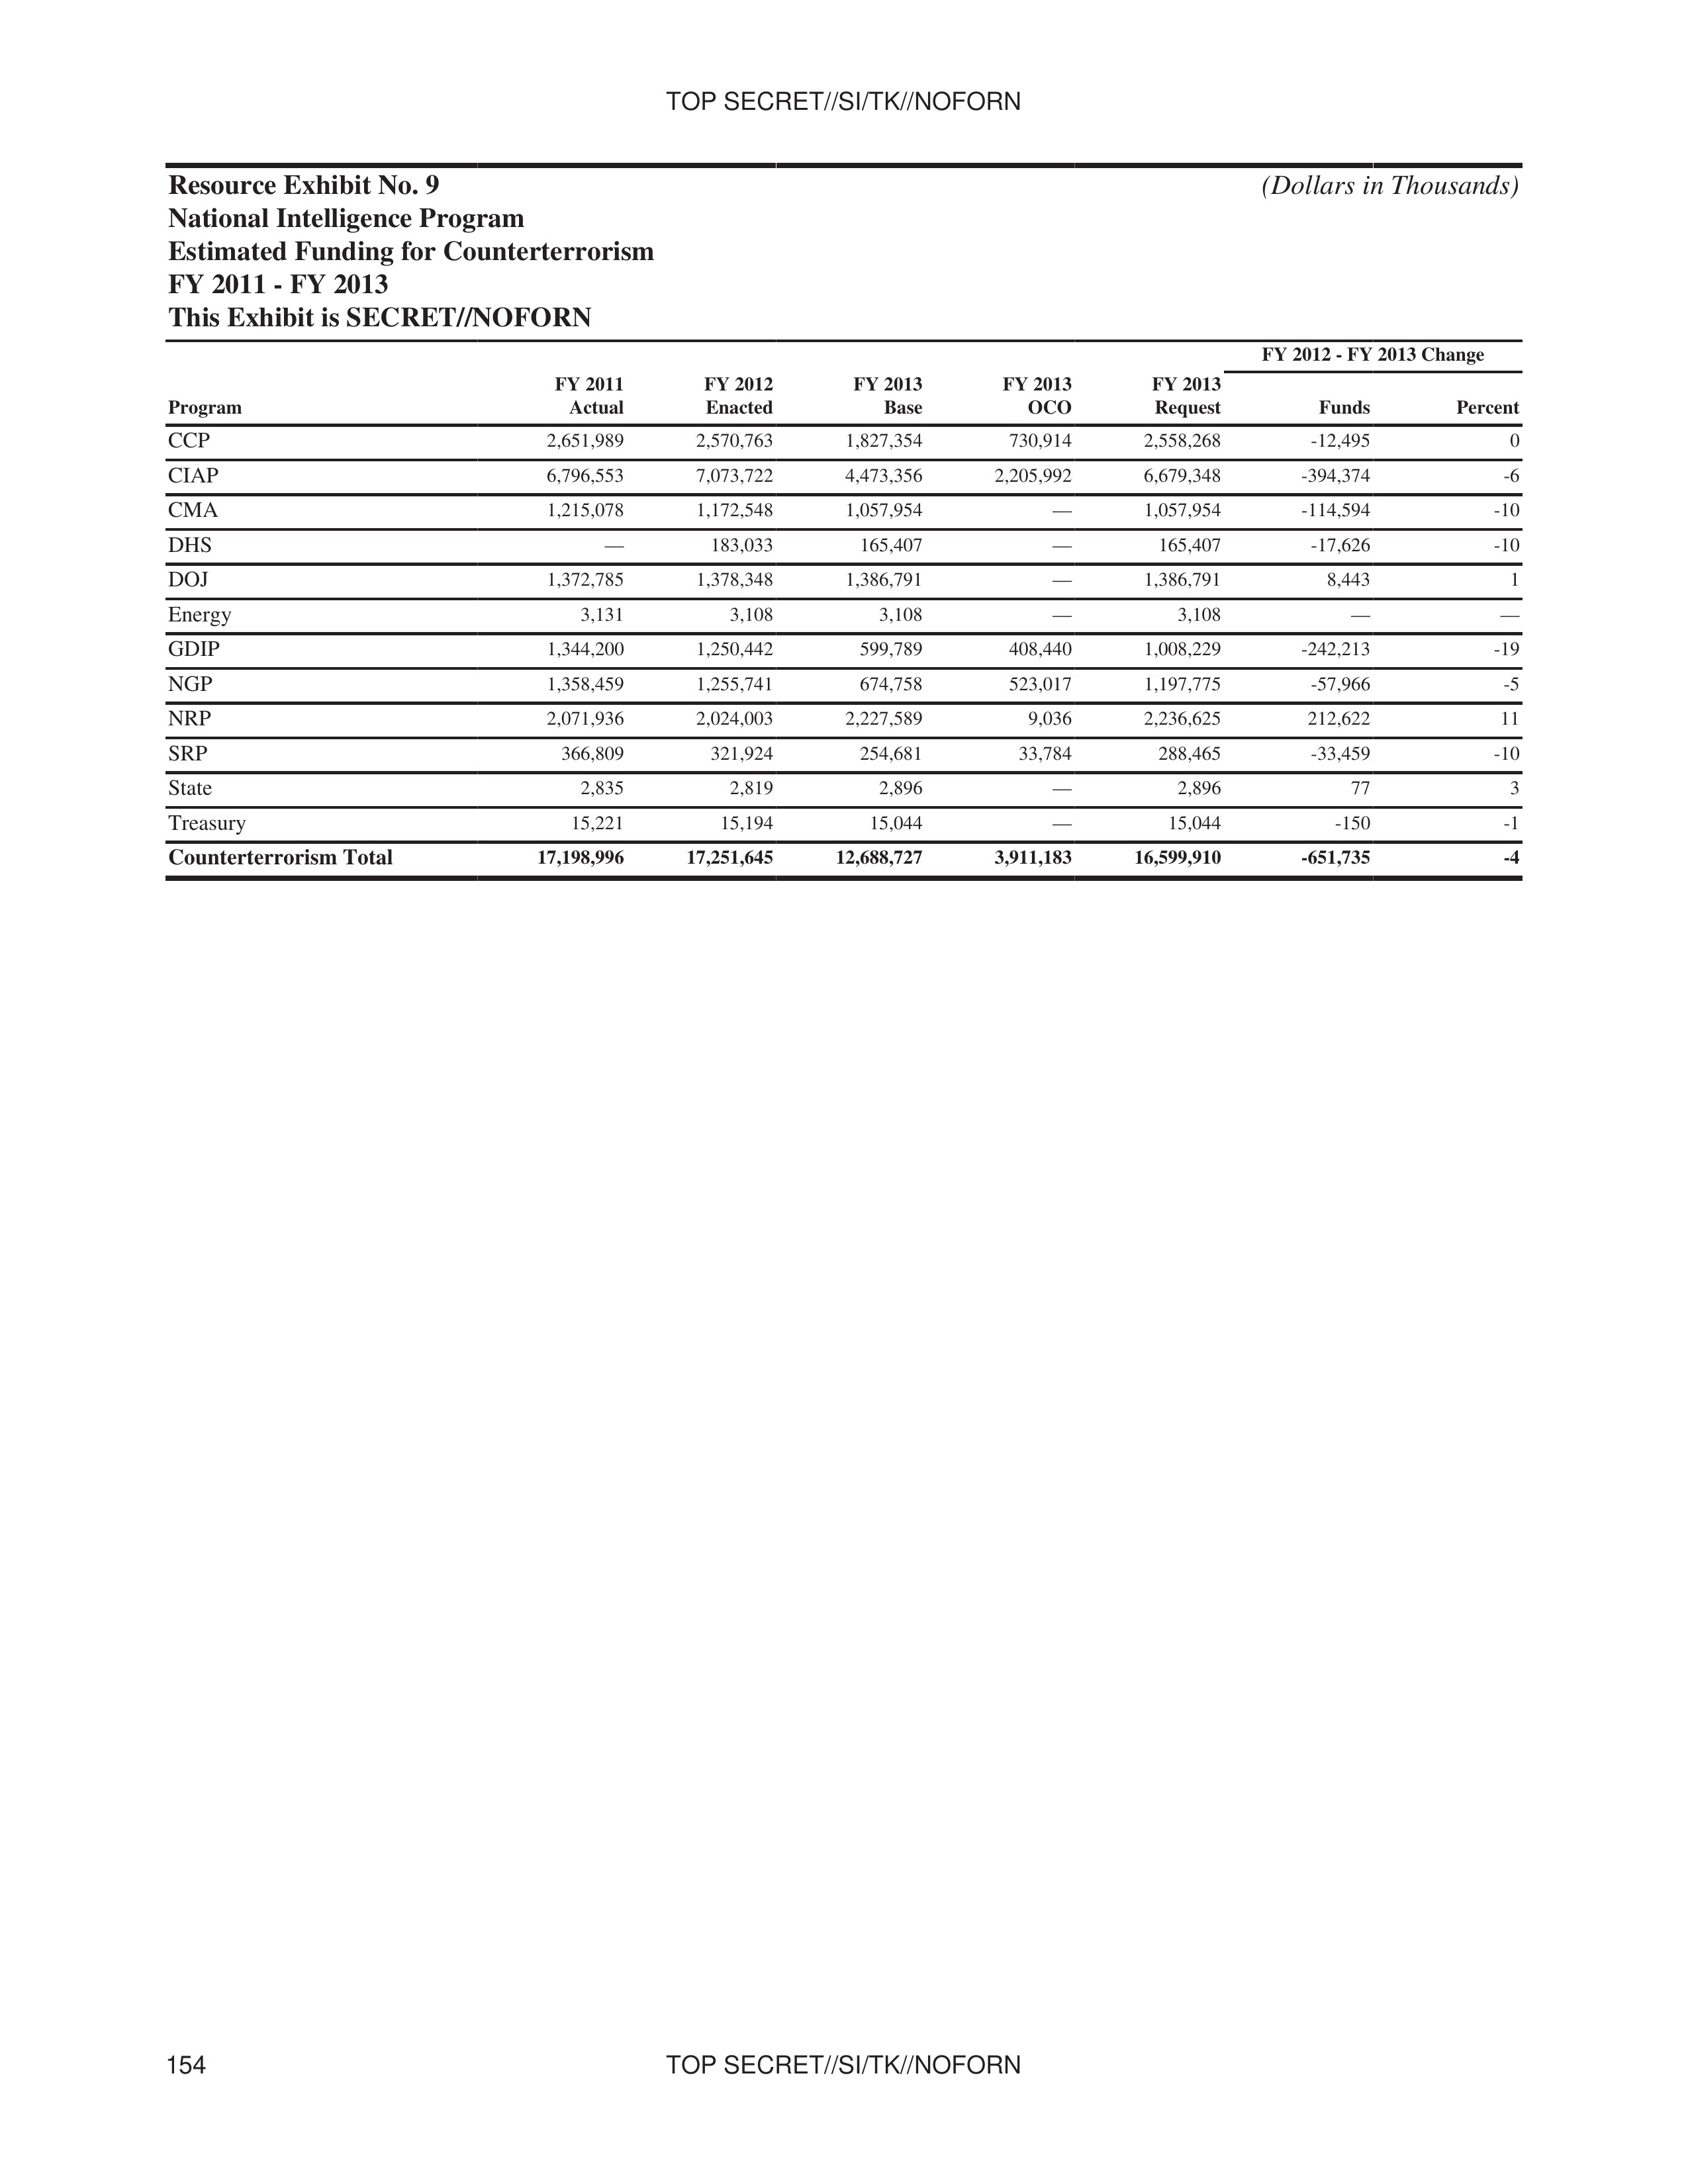
Resource Exhibit No. 9
National Intelligence Program
Estimated Funding for Counterterrorism
FY 2011 - FY 2013
This Exhibit is SECRET//NOFORN
(Dollars in Thousands)
| Program | FY 2011 Actual | FY 2012 Enacted | FY 2013 Base | FY 2013 OCO | FY 2013 Request | FY 2012 - FY 2013 Change Funds | FY 2012 - FY 2013 Change Percent |
|---|---|---|---|---|---|---|---|
| CCP | 2,651,989 | 2,570,763 | 1,827,354 | 730,914 | 2,558,268 | -12,495 | 0 |
| CIAP | 6,796,553 | 7,073,722 | 4,473,356 | 2,205,992 | 6,679,348 | -394,374 | -6 |
| CMA | 1,215,078 | 1,172,548 | 1,057,954 | — | 1,057,954 | -114,594 | -10 |
| DHS | — | 183,033 | 165,407 | — | 165,407 | -17,626 | -10 |
| DOJ | 1,372,785 | 1,378,348 | 1,386,791 | — | 1,386,791 | 8,443 | 1 |
| Energy | 3,131 | 3,108 | 3,108 | — | 3,108 | — | — |
| GDIP | 1,344,200 | 1,250,442 | 599,789 | 408,440 | 1,008,229 | -242,213 | -19 |
| NGP | 1,358,459 | 1,255,741 | 674,758 | 523,017 | 1,197,775 | -57,966 | -5 |
| NRP | 2,071,936 | 2,024,003 | 2,227,589 | 9,036 | 2,236,625 | 212,622 | 11 |
| SRP | 366,809 | 321,924 | 254,681 | 33,784 | 288,465 | -33,459 | -10 |
| State | 2,835 | 2,819 | 2,896 | — | 2,896 | 77 | 3 |
| Treasury | 15,221 | 15,194 | 15,044 | — | 15,044 | -150 | -1 |
| Counterterrorism Total | 17,198,996 | 17,251,645 | 12,688,727 | 3,911,183 | 16,599,910 | -651,735 | -4 |
154 TOP SECRET//SI/TK//NOFORN
TOP SECRET//SI/TK//NOFORN
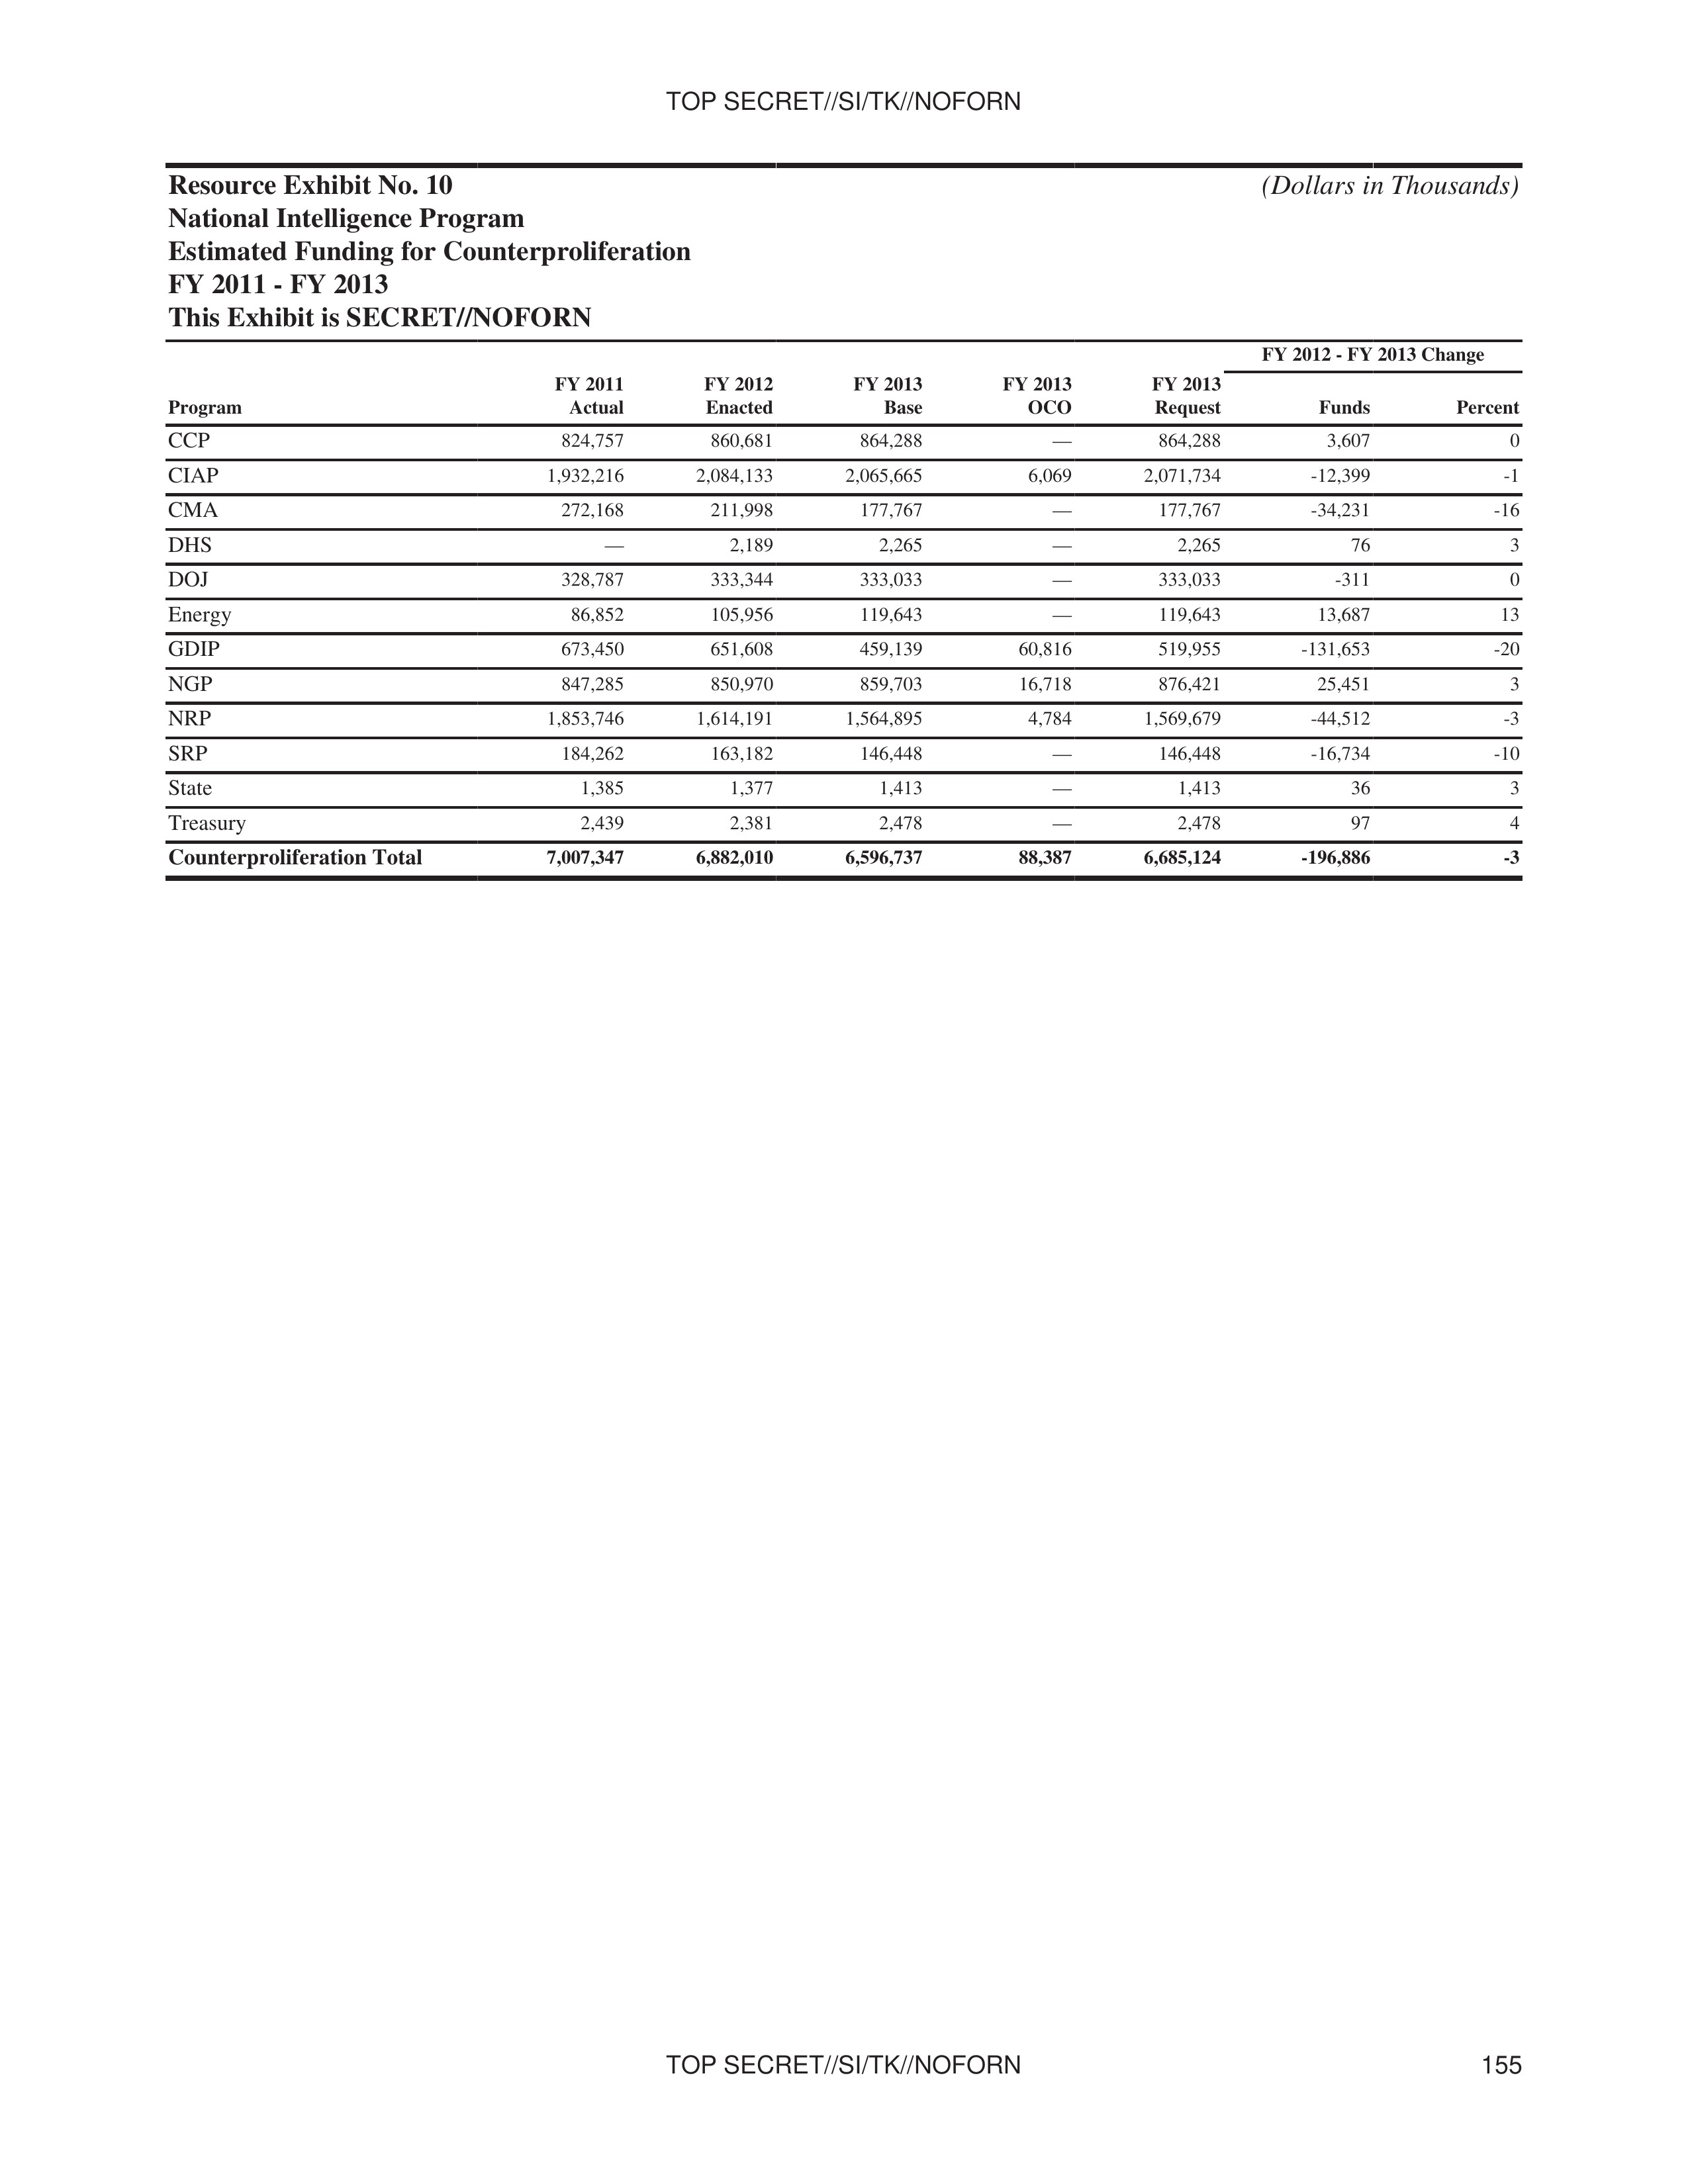
Resource Exhibit No. 10
National Intelligence Program
Estimated Funding for Counterproliferation
FY 2011 - FY 2013
This Exhibit is SECRET//NOFORN
(Dollars in Thousands)
| Program | FY 2011 Actual | FY 2012 Enacted | FY 2013 Base | FY 2013 OCO | FY 2013 Request | FY 2012 - FY 2013 Change Funds | FY 2012 - FY 2013 Change Percent |
|---|---|---|---|---|---|---|---|
| CCP | 824,757 | 860,681 | 864,288 | — | 864,288 | 3,607 | 0 |
| CIAP | 1,932,216 | 2,084,133 | 2,065,665 | 6,069 | 2,071,734 | -12,399 | -1 |
| CMA | 272,168 | 211,998 | 177,767 | — | 177,767 | -34,231 | -16 |
| DHS | — | 2,189 | 2,265 | — | 2,265 | 76 | 3 |
| DOJ | 328,787 | 333,344 | 333,033 | — | 333,033 | -311 | 0 |
| Energy | 86,852 | 105,956 | 119,643 | — | 119,643 | 13,687 | 13 |
| GDIP | 673,450 | 651,608 | 459,139 | 60,816 | 519,955 | -131,653 | -20 |
| NGP | 847,285 | 850,970 | 859,703 | 16,718 | 876,421 | 25,451 | 3 |
| NRP | 1,853,746 | 1,614,191 | 1,564,895 | 4,784 | 1,569,679 | -44,512 | -3 |
| SRP | 184,262 | 163,182 | 146,448 | — | 146,448 | -16,734 | -10 |
| State | 1,385 | 1,377 | 1,413 | — | 1,413 | 36 | 3 |
| Treasury | 2,439 | 2,381 | 2,478 | — | 2,478 | 97 | 4 |
| Counterproliferation Total | 7,007,347 | 6,882,010 | 6,596,737 | 88,387 | 6,685,124 | -196,886 | -3 |
TOP SECRET//SI/TK//NOFORN 155
TOP SECRET//SI/TK//NOFORN
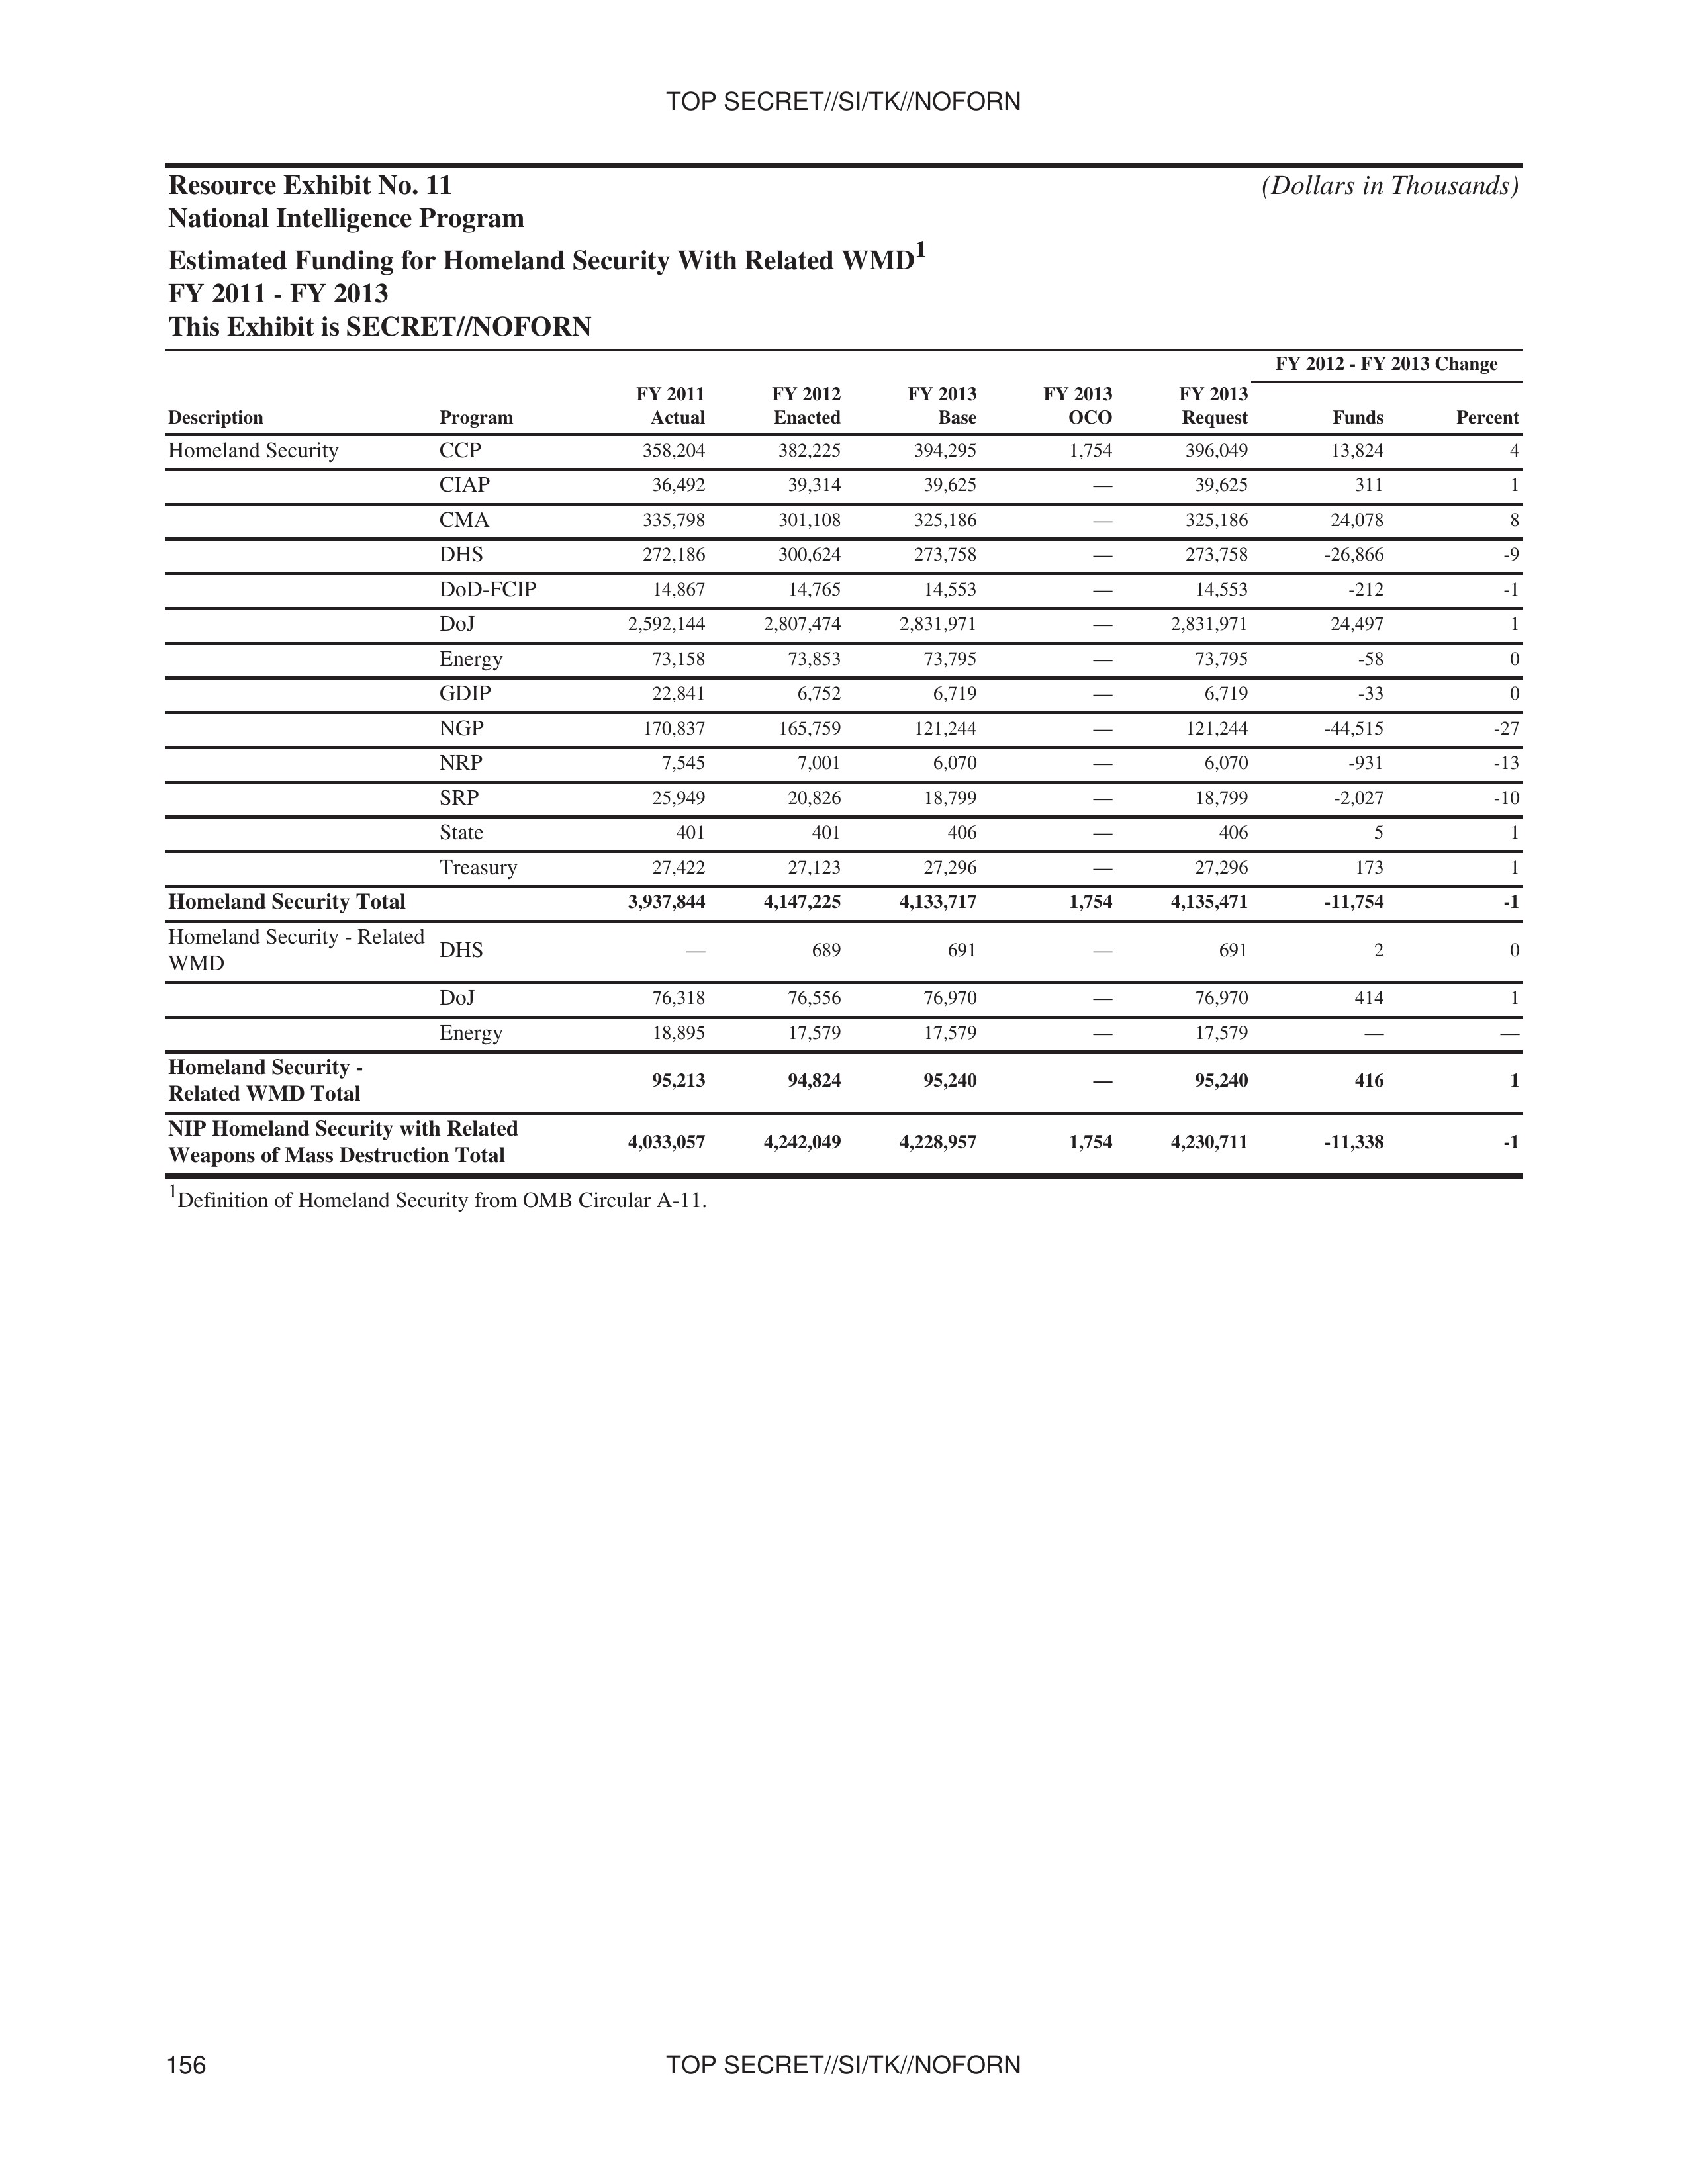
Resource Exhibit No. 11
National Intelligence Program
Estimated Funding for Homeland Security With Related WMD¹
FY 2011 - FY 2013
This Exhibit is SECRET//NOFORN
(Dollars in Thousands)
| Description | Program | FY 2011 Actual | FY 2012 Enacted | FY 2013 Base | FY 2013 OCO | FY 2013 Request | FY 2012 - FY 2013 Change Funds | FY 2012 - FY 2013 Change Percent |
|---|---|---|---|---|---|---|---|---|
| Homeland Security | CCP | 358,204 | 382,225 | 394,295 | 1,754 | 396,049 | 13,824 | 4 |
| CIAP | 36,492 | 39,314 | 39,625 | — | 39,625 | 311 | 1 | |
| CMA | 335,798 | 301,108 | 325,186 | — | 325,186 | 24,078 | 8 | |
| DHS | 272,186 | 300,624 | 273,758 | — | 273,758 | -26,866 | -9 | |
| DOD-FCIP | 14,867 | 14,765 | 14,553 | — | 14,553 | -212 | -1 | |
| DoJ | 2,592,144 | 2,807,474 | 2,831,971 | — | 2,831,971 | 24,497 | 1 | |
| Energy | 73,158 | 73,853 | 73,795 | — | 73,795 | -58 | 0 | |
| GDIP | 22,841 | 6,752 | 6,719 | — | 6,719 | -33 | 0 | |
| NGP | 170,837 | 165,759 | 121,244 | — | 121,244 | -44,515 | -27 | |
| NRP | 7,545 | 7,001 | 6,070 | — | 6,070 | -931 | -13 | |
| SRP | 25,949 | 20,826 | 18,799 | — | 18,799 | -2,027 | -10 | |
| State | 401 | 401 | 406 | — | 406 | 5 | 1 | |
| Treasury | 27,422 | 27,123 | 27,296 | — | 27,296 | 173 | 1 | |
| Homeland Security Total | 3,937,844 | 4,147,225 | 4,133,717 | 1,754 | 4,135,471 | -11,754 | -1 | |
| Homeland Security - Related WMD | DHS | — | 689 | 691 | — | 691 | 2 | 0 |
| DoJ | 76,318 | 76,556 | 76,970 | — | 76,970 | 414 | 1 | |
| Energy | 18,895 | 17,579 | 17,579 | — | 17,579 | — | — | |
| Homeland Security - Related WMD Total | 95,213 | 94,824 | 95,240 | — | 95,240 | 416 | 1 | |
| NIP Homeland Security with Related Weapons of Mass Destruction Total | 4,033,057 | 4,242,049 | 4,228,957 | 1,754 | 4,230,711 | -11,338 | -1 |
¹ Definition of Homeland Security from OMB Circular A-11.
156 TOP SECRET//SI/TK//NOFORN
TOP SECRET//SI/TK//NOFORN
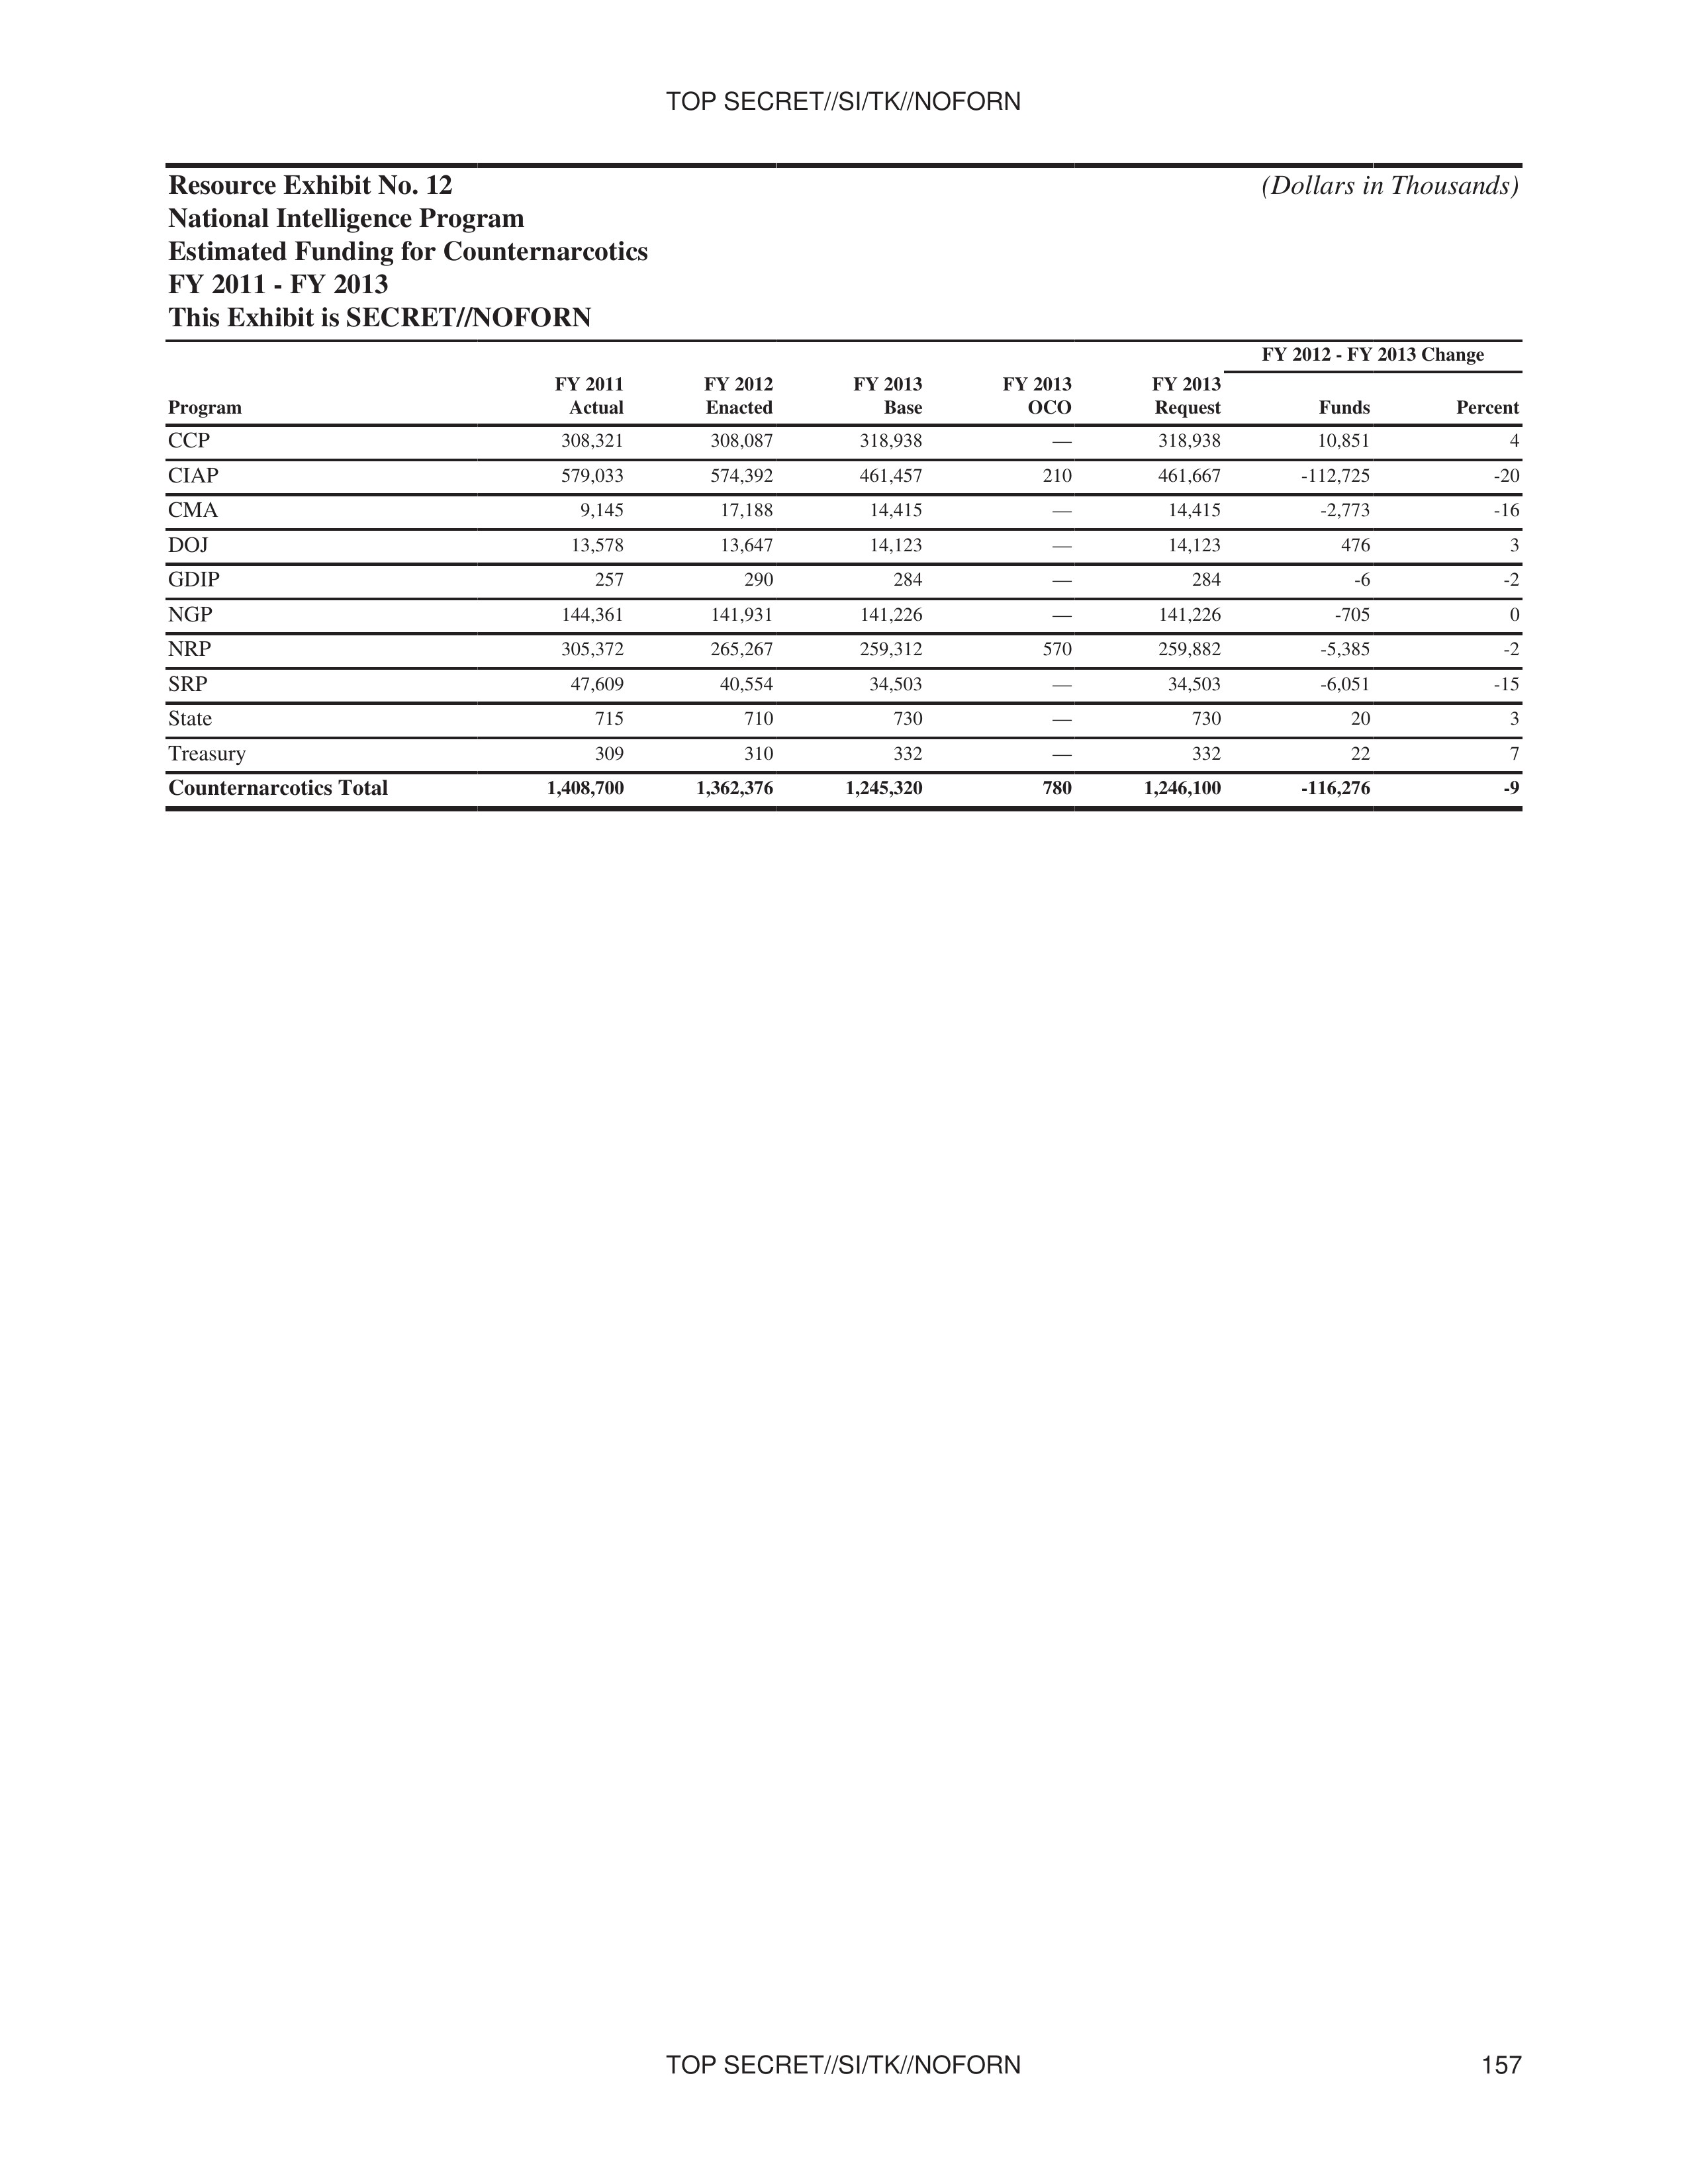
Resource Exhibit No. 12
National Intelligence Program
Estimated Funding for Counternarcotics
FY 2011 - FY 2013
This Exhibit is SECRET//NOFORN
(Dollars in Thousands)
| Program | FY 2011 Actual | FY 2012 Enacted | FY 2013 Base | FY 2013 OCO | FY 2013 Request | FY 2012 - FY 2013 Change Funds | FY 2012 - FY 2013 Change Percent |
|---|---|---|---|---|---|---|---|
| CCP | 308,321 | 308,087 | 318,938 | — | 318,938 | 10,851 | 4 |
| CIAP | 579,033 | 574,392 | 461,457 | 210 | 461,667 | -112,725 | -20 |
| CMA | 9,145 | 17,188 | 14,415 | — | 14,415 | -2,773 | -16 |
| DOJ | 13,578 | 13,647 | 14,123 | — | 14,123 | 476 | 3 |
| GDIP | 257 | 290 | 284 | — | 284 | -6 | -2 |
| NGP | 144,361 | 141,931 | 141,226 | — | 141,226 | -705 | 0 |
| NRP | 305,372 | 265,267 | 259,312 | 570 | 259,882 | -5,385 | -2 |
| SRP | 47,609 | 40,554 | 34,503 | — | 34,503 | -6,051 | -15 |
| State | 715 | 710 | 730 | — | 730 | 20 | 3 |
| Treasury | 309 | 310 | 332 | — | 332 | 22 | 7 |
| Counternarcotics Total | 1,408,700 | 1,362,376 | 1,245,320 | 780 | 1,246,100 | -116,276 | -9 |
TOP SECRET//SI/TK//NOFORN 157
TOP SECRET//SI/TK//NOFORN
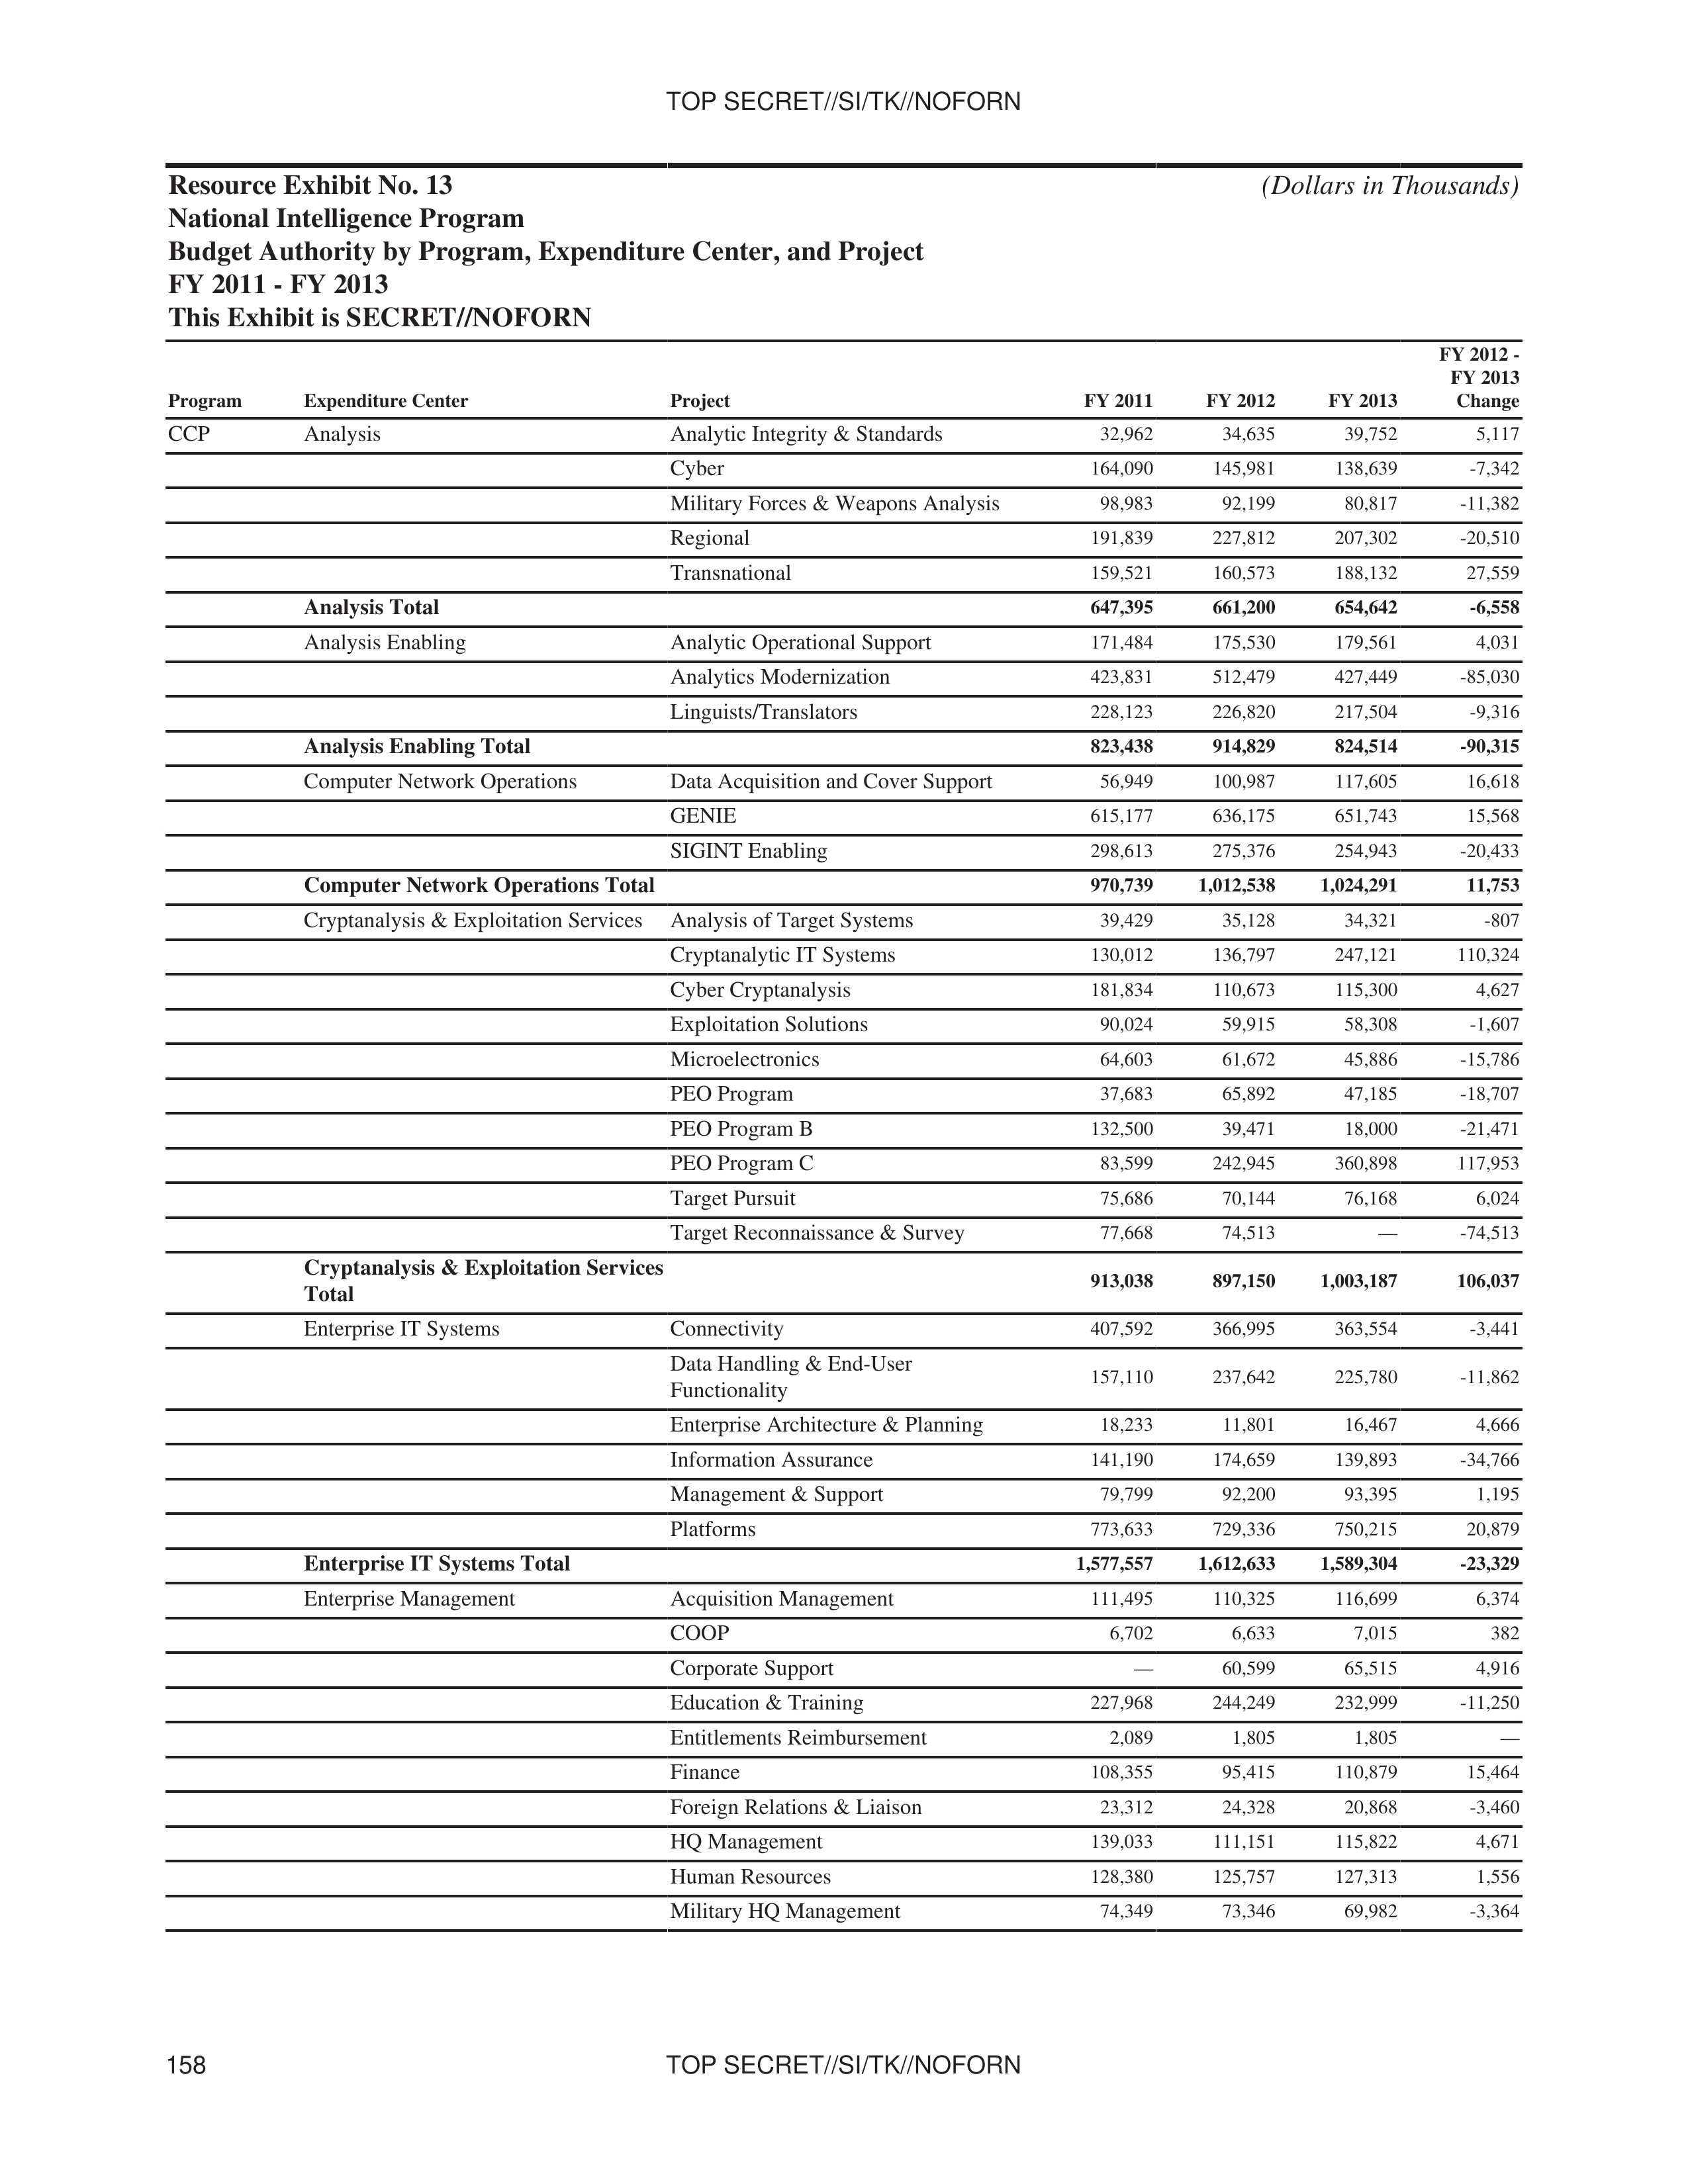
Resource Exhibit No. 13
National Intelligence Program
Budget Authority by Program, Expenditure Center, and Project
FY 2011 - FY 2013
This Exhibit is SECRET//NOFORN
(Dollars in Thousands)
| Program | Expenditure Center | Project | FY 2011 | FY 2012 | FY 2013 | FY 2012-FY 2013 Change |
|---|---|---|---|---|---|---|
| CCP | Analysis | Analytic Integrity & Standards | 32,962 | 34,635 | 39,752 | 5,117 |
| Cyber | 164,090 | 145,981 | 138,639 | -7,342 | ||
| Military Forces & Weapons Analysis | 98,983 | 92,199 | 80,817 | -11,382 | ||
| Regional | 191,839 | 227,812 | 207,302 | -20,510 | ||
| Transnational | 159,521 | 160,573 | 188,132 | 27,559 | ||
| Analysis Total | 647,395 | 661,200 | 654,642 | -6,558 | ||
| Analysis Enabling | Analytic Operational Support | 171,484 | 175,530 | 179,561 | 4,031 | |
| Analytics Modernization | 423,831 | 512,479 | 427,449 | -85,030 | ||
| Linguists/Translators | 228,123 | 226,820 | 217,504 | -9,316 | ||
| Analysis Enabling Total | 823,438 | 914,829 | 824,514 | -90,315 | ||
| Computer Network Operations | Data Acquisition and Cover Support | 56,949 | 100,987 | 117,605 | 16,618 | |
| GENIE | 615,177 | 636,175 | 651,743 | 15,568 | ||
| SIGINT Enabling | 298,613 | 275,376 | 254,943 | -20,433 | ||
| Computer Network Operations Total | 970,739 | 1,012,538 | 1,024,291 | 11,753 | ||
| Cryptanalysis & Exploitation Services | Analysis of Target Systems | 39,429 | 35,128 | 34,321 | -807 | |
| Cryptanalytic IT Systems | 130,012 | 136,797 | 247,121 | 110,324 | ||
| Cyber Cryptanalysis | 181,834 | 110,673 | 115,300 | 4,627 | ||
| Exploitation Solutions | 90,024 | 59,915 | 58,308 | -1,607 | ||
| Microelectronics | 64,603 | 61,672 | 45,886 | -15,786 | ||
| PEO Program | 37,683 | 65,892 | 47,185 | -18,707 | ||
| PEO Program B | 132,500 | 39,471 | 18,000 | -21,471 | ||
| PEO Program C | 83,599 | 242,945 | 360,898 | 117,953 | ||
| Target Pursuit | 75,686 | 70,144 | 76,168 | 6,024 | ||
| Target Reconnaissance & Survey | 77,668 | 74,513 | — | -74,513 | ||
| Cryptanalysis & Exploitation Services Total | 913,038 | 897,150 | 1,003,187 | 106,037 | ||
| Enterprise IT Systems | Connectivity | 407,592 | 366,995 | 363,554 | -3,441 | |
| Data Handling & End-User Functionality | 157,110 | 237,642 | 225,780 | -11,862 | ||
| Enterprise Architecture & Planning | 18,233 | 11,801 | 16,467 | 4,666 | ||
| Information Assurance | 141,190 | 174,659 | 139,893 | -34,766 | ||
| Management & Support | 79,799 | 92,200 | 93,395 | 1,195 | ||
| Platforms | 773,633 | 729,336 | 750,215 | 20,879 | ||
| Enterprise IT Systems Total | 1,577,557 | 1,612,633 | 1,589,304 | -23,329 | ||
| Enterprise Management | Acquisition Management | 111,495 | 110,325 | 116,699 | 6,374 | |
| COOP | 6,702 | 6,633 | 7,015 | 382 | ||
| Corporate Support | — | 60,599 | 65,515 | 4,916 | ||
| Education & Training | 227,968 | 244,249 | 232,999 | -11,250 | ||
| Entitlements Reimbursement | 2,089 | 1,805 | 1,805 | — | ||
| Finance | 108,355 | 95,415 | 110,879 | 15,464 | ||
| Foreign Relations & Liaison | 23,312 | 24,328 | 20,868 | -3,460 | ||
| HQ Management | 139,033 | 111,151 | 115,822 | 4,671 | ||
| Human Resources | 128,380 | 125,757 | 127,313 | 1,556 | ||
| Military HQ Management | 74,349 | 73,346 | 69,982 | -3,364 |
158 TOP SECRET//SI/TK//NOFORN
TOP SECRET//SI//TK//NOFORN
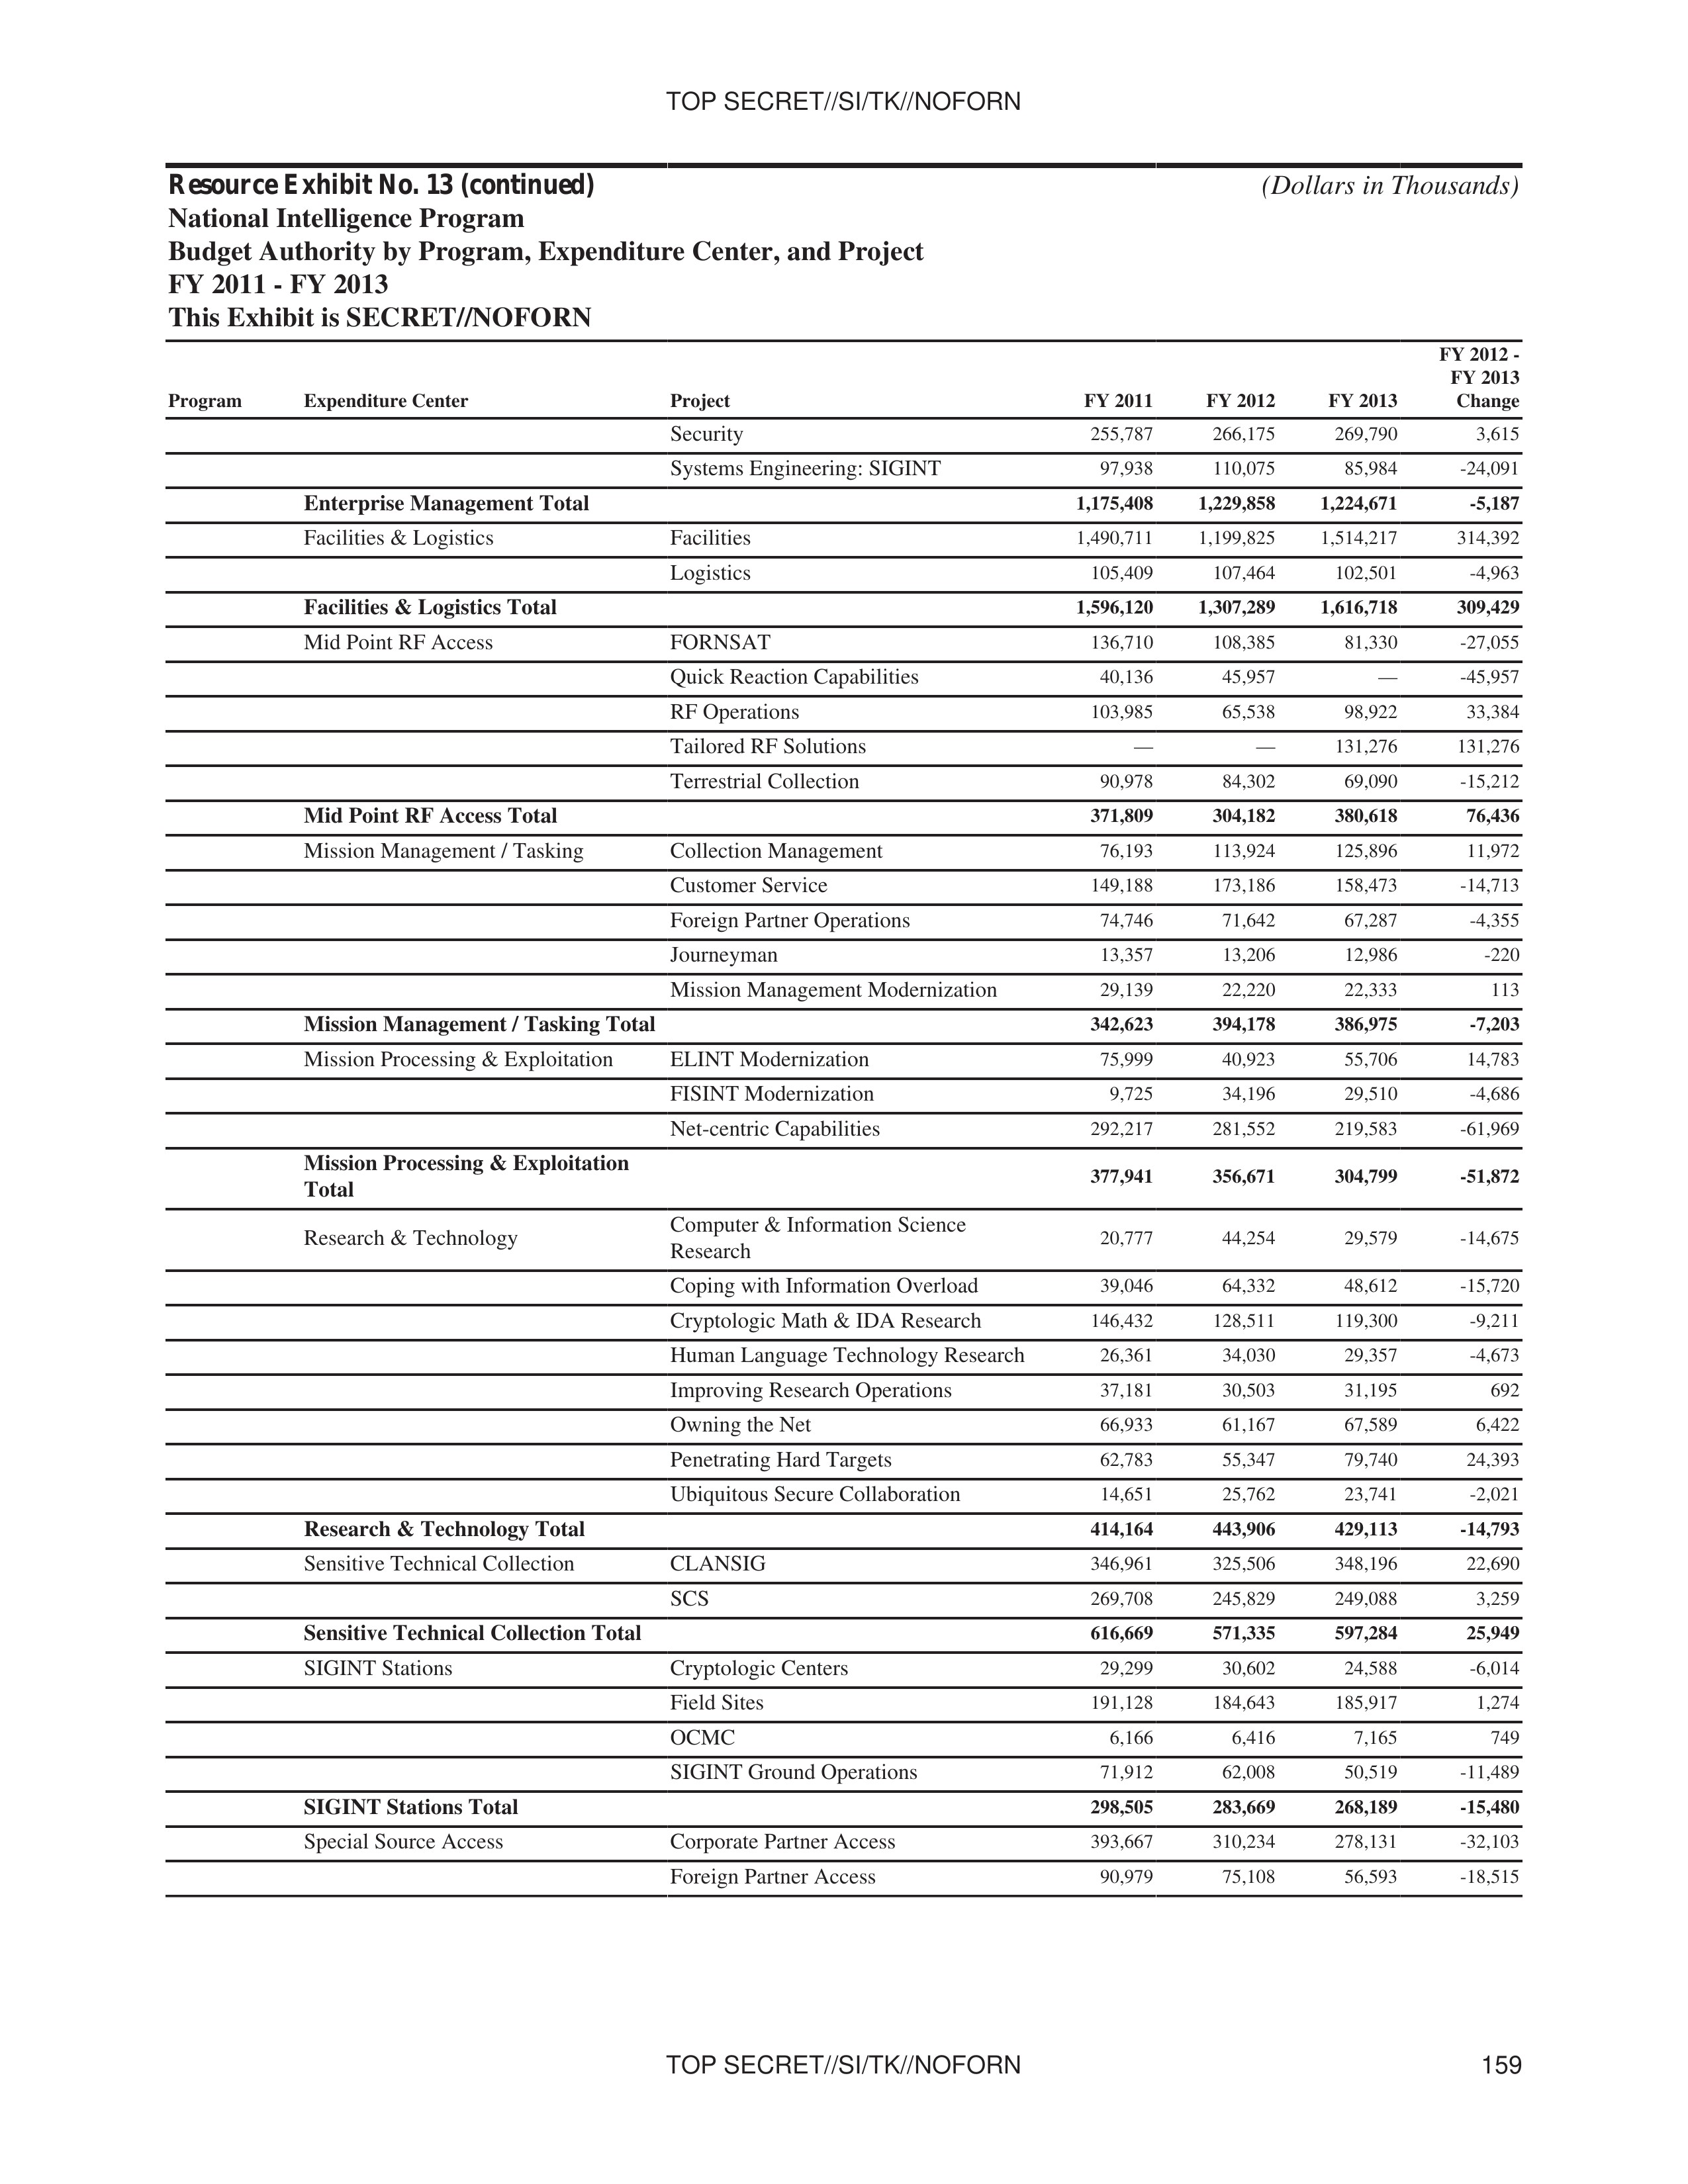
Resource Exhibit No. 13 (continued)
National Intelligence Program
Budget Authority by Program, Expenditure Center, and Project
FY 2011 - FY 2013
This Exhibit is SECRET//NOFORN
(Dollars in Thousands)
| Program | Expenditure Center | Project | FY 2011 | FY 2012 | FY 2013 | FY 2012 - FY 2013 Change |
|---|---|---|---|---|---|---|
| Security | 255,787 | 266,175 | 269,790 | 3,615 | ||
| Systems Engineering: SIGINT | 97,938 | 110,075 | 85,984 | -24,091 | ||
| Enterprise Management Total | 1,175,408 | 1,229,858 | 1,224,671 | -5,187 | ||
| Facilities & Logistics | Facilities | 1,490,711 | 1,199,825 | 1,514,217 | 314,392 | |
| Logistics | 105,409 | 107,464 | 102,501 | -4,963 | ||
| Facilities & Logistics Total | 1,596,120 | 1,307,289 | 1,616,718 | 309,429 | ||
| Mid Point RF Access | FORNSAT | 136,710 | 108,385 | 81,330 | -27,055 | |
| Quick Reaction Capabilities | 40,136 | 45,957 | — | -45,957 | ||
| RF Operations | 103,985 | 65,538 | 98,922 | 33,384 | ||
| Tailored RF Solutions | — | — | 131,276 | 131,276 | ||
| Terrestrial Collection | 90,978 | 84,302 | 69,090 | -15,212 | ||
| Mid Point RF Access Total | 371,809 | 304,182 | 380,618 | 76,436 | ||
| Mission Management / Tasking | Collection Management | 76,193 | 113,924 | 125,896 | 11,972 | |
| Customer Service | 149,188 | 173,186 | 158,473 | -14,713 | ||
| Foreign Partner Operations | 74,746 | 71,642 | 67,287 | -4,355 | ||
| Journeyman | 13,357 | 13,206 | 12,986 | -220 | ||
| Mission Management Modernization | 29,139 | 22,220 | 22,333 | 113 | ||
| Mission Management / Tasking Total | 342,623 | 394,178 | 386,975 | -7,203 | ||
| Mission Processing & Exploitation | ELINT Modernization | 75,999 | 40,923 | 55,706 | 14,783 | |
| FISINT Modernization | 9,725 | 34,196 | 29,510 | -4,686 | ||
| Net-centric Capabilities | 292,217 | 281,552 | 219,583 | -61,969 | ||
| Mission Processing & Exploitation Total | 377,941 | 356,671 | 304,799 | -51,872 | ||
| Research & Technology | Computer & Information Science Research | 20,777 | 44,254 | 29,579 | -14,675 | |
| Coping with Information Overload | 39,046 | 64,332 | 48,612 | -15,720 | ||
| Cryptologic Math & IDA Research | 146,432 | 128,511 | 119,300 | -9,211 | ||
| Human Language Technology Research | 26,361 | 34,030 | 29,357 | -4,673 | ||
| Improving Research Operations | 37,181 | 30,503 | 31,195 | 692 | ||
| Owning the Net | 66,933 | 61,167 | 67,589 | 6,422 | ||
| Penetrating Hard Targets | 62,783 | 55,347 | 79,740 | 24,393 | ||
| Ubiquitous Secure Collaboration | 14,651 | 25,762 | 23,741 | -2,021 | ||
| Research & Technology Total | 414,164 | 443,906 | 429,113 | -14,793 | ||
| Sensitive Technical Collection | CLANSIG | 346,961 | 325,506 | 348,196 | 22,690 | |
| SCS | 269,708 | 245,829 | 249,088 | 3,259 | ||
| Sensitive Technical Collection Total | 616,669 | 571,335 | 597,284 | 25,949 | ||
| SIGINT Stations | Cryptologic Centers | 29,299 | 30,602 | 24,588 | -6,014 | |
| Field Sites | 191,128 | 184,643 | 185,917 | 1,274 | ||
| OCMC | 6,166 | 6,416 | 7,165 | 749 | ||
| SIGINT Ground Operations | 71,912 | 62,008 | 50,519 | -11,489 | ||
| SIGINT Stations Total | 298,505 | 283,669 | 268,189 | -15,480 | ||
| Special Source Access | Corporate Partner Access | 393,667 | 310,234 | 278,131 | -32,103 | |
| Foreign Partner Access | 90,979 | 75,108 | 56,593 | -18,515 |
TOP SECRET//SI/TK//NOFORN 159
TOP SECRET//SI/TK//NOFORN
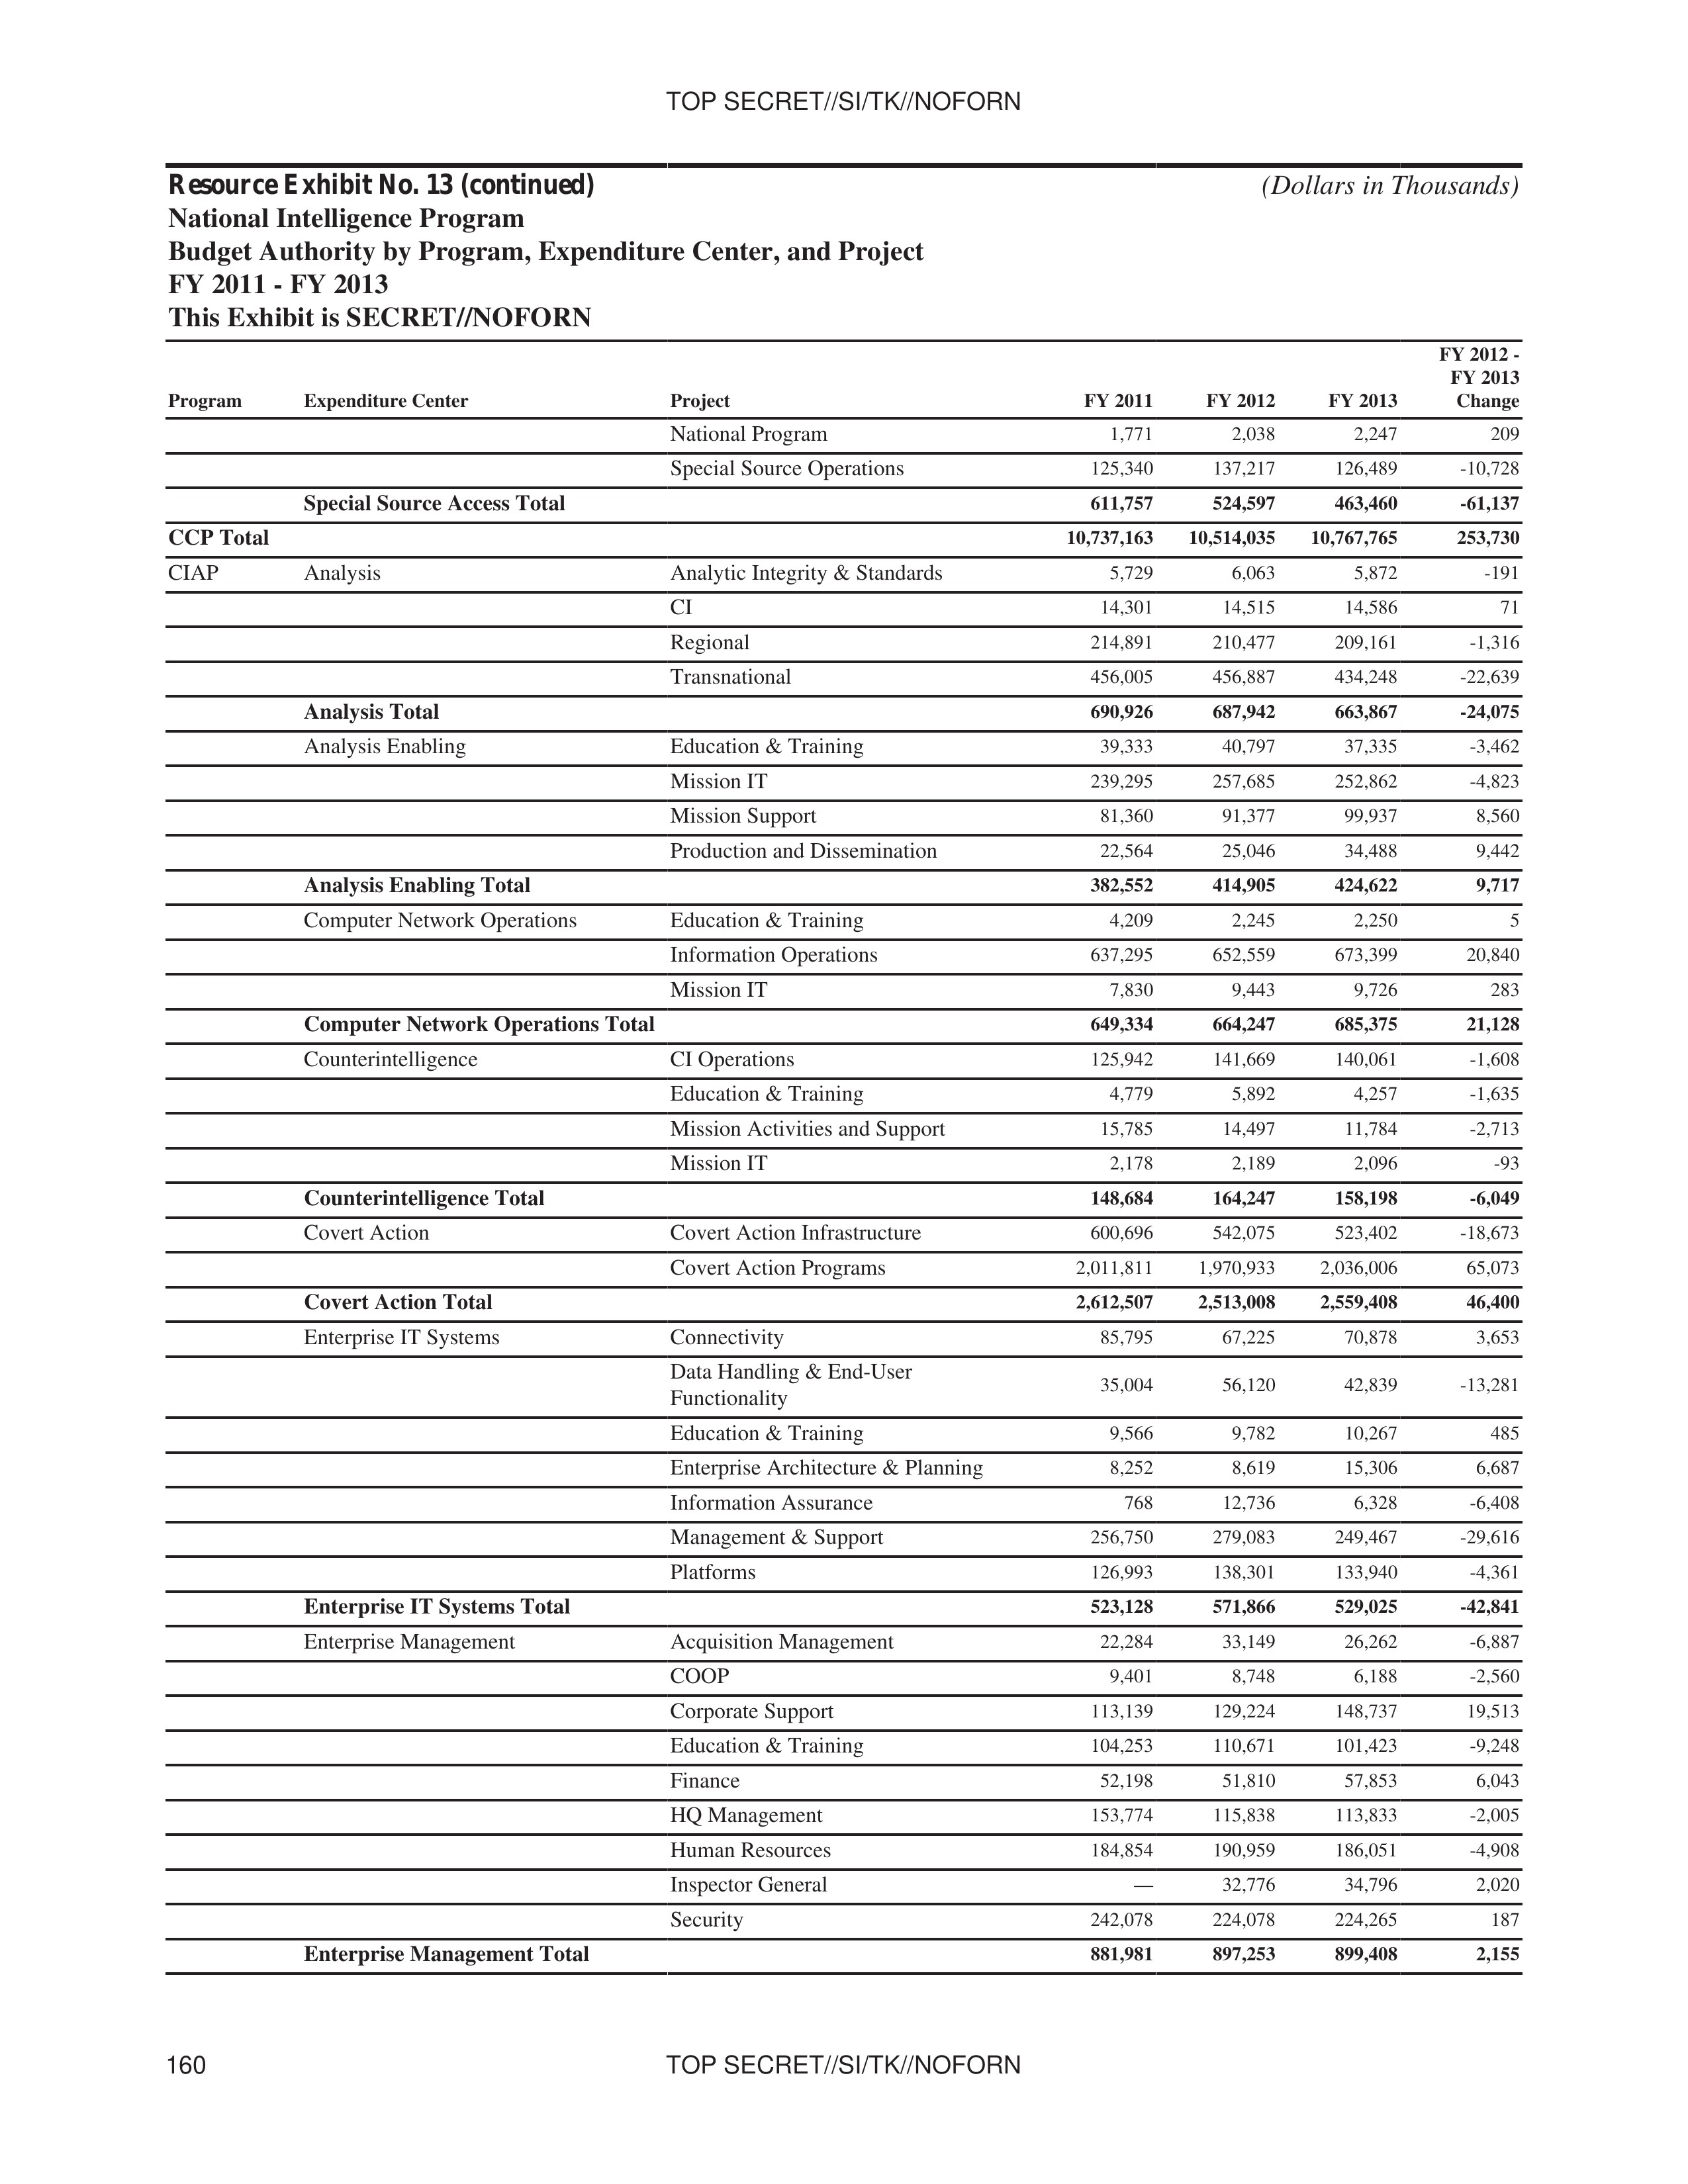
Resource Exhibit No. 13 (continued)
National Intelligence Program
Budget Authority by Program, Expenditure Center, and Project
FY 2011 - FY 2013
This Exhibit is SECRET//NOFORN
(Dollars in Thousands)
| Program | Expenditure Center | Project | FY 2011 | FY 2012 | FY 2013 | FY 2012 - FY 2013 Change |
|---|---|---|---|---|---|---|
| National Program | 1,771 | 2,038 | 2,247 | 209 | ||
| Special Source Operations | 125,340 | 137,217 | 126,489 | -10,728 | ||
| Special Source Access Total | 611,757 | 524,597 | 463,460 | -61,137 | ||
| CCP Total | 10,737,163 | 10,514,035 | 10,767,765 | 253,730 | ||
| CIAP | Analysis | Analytic Integrity & Standards | 5,729 | 6,063 | 5,872 | -191 |
| CI | 14,301 | 14,515 | 14,586 | 71 | ||
| Regional | 214,891 | 210,477 | 209,161 | -1,316 | ||
| Transnational | 456,005 | 456,887 | 434,248 | -22,639 | ||
| Analysis Total | 690,926 | 687,942 | 663,867 | -24,075 | ||
| Analysis Enabling | Education & Training | 39,333 | 40,797 | 37,335 | -3,462 | |
| Mission IT | 239,295 | 257,685 | 252,862 | -4,823 | ||
| Mission Support | 81,360 | 91,377 | 99,937 | 8,560 | ||
| Production and Dissemination | 22,564 | 25,046 | 34,488 | 9,442 | ||
| Analysis Enabling Total | 382,552 | 414,905 | 424,622 | 9,717 | ||
| Computer Network Operations | Education & Training | 4,209 | 2,245 | 2,250 | 5 | |
| Information Operations | 637,295 | 652,559 | 673,399 | 20,840 | ||
| Mission IT | 7,830 | 9,443 | 9,726 | 283 | ||
| Computer Network Operations Total | 649,334 | 664,247 | 685,375 | 21,128 | ||
| Counterintelligence | CI Operations | 125,942 | 141,669 | 140,061 | -1,608 | |
| Education & Training | 4,779 | 5,892 | 4,257 | -1,635 | ||
| Mission Activities and Support | 15,785 | 14,497 | 11,784 | -2,713 | ||
| Mission IT | 2,178 | 2,189 | 2,096 | -93 | ||
| Counterintelligence Total | 148,684 | 164,247 | 158,198 | -6,049 | ||
| Covert Action | Covert Action Infrastructure | 600,696 | 542,075 | 523,402 | -18,673 | |
| Covert Action Programs | 2,011,811 | 1,970,933 | 2,036,006 | 65,073 | ||
| Covert Action Total | 2,612,507 | 2,513,008 | 2,559,408 | 46,400 | ||
| Enterprise IT Systems | Connectivity | 85,795 | 67,225 | 70,878 | 3,653 | |
| Data Handling & End-User Functionality | 35,004 | 56,120 | 42,839 | -13,281 | ||
| Education & Training | 9,566 | 9,782 | 10,267 | 485 | ||
| Enterprise Architecture & Planning | 8,252 | 8,619 | 15,306 | 6,687 | ||
| Information Assurance | 768 | 12,736 | 6,328 | -6,408 | ||
| Management & Support | 256,750 | 279,083 | 249,467 | -29,616 | ||
| Platforms | 126,993 | 138,301 | 133,940 | -4,361 | ||
| Enterprise IT Systems Total | 523,128 | 571,866 | 529,025 | -42,841 | ||
| Enterprise Management | Acquisition Management | 22,284 | 33,149 | 26,262 | -6,887 | |
| COOP | 9,401 | 8,748 | 6,188 | -2,560 | ||
| Corporate Support | 113,139 | 129,224 | 148,737 | 19,513 | ||
| Education & Training | 104,253 | 110,671 | 101,423 | -9,248 | ||
| Finance | 52,198 | 51,810 | 57,853 | 6,043 | ||
| HQ Management | 153,774 | 115,838 | 113,833 | -2,005 | ||
| Human Resources | 184,854 | 190,959 | 186,051 | -4,908 | ||
| Inspector General | — | 32,776 | 34,796 | 2,020 | ||
| Security | 242,078 | 224,078 | 224,265 | 187 | ||
| Enterprise Management Total | 881,981 | 897,253 | 899,408 | 2,155 |
160
TOP SECRET//SI/TK//NOFORN
TOP SECRET//SI/TK//NOFORN
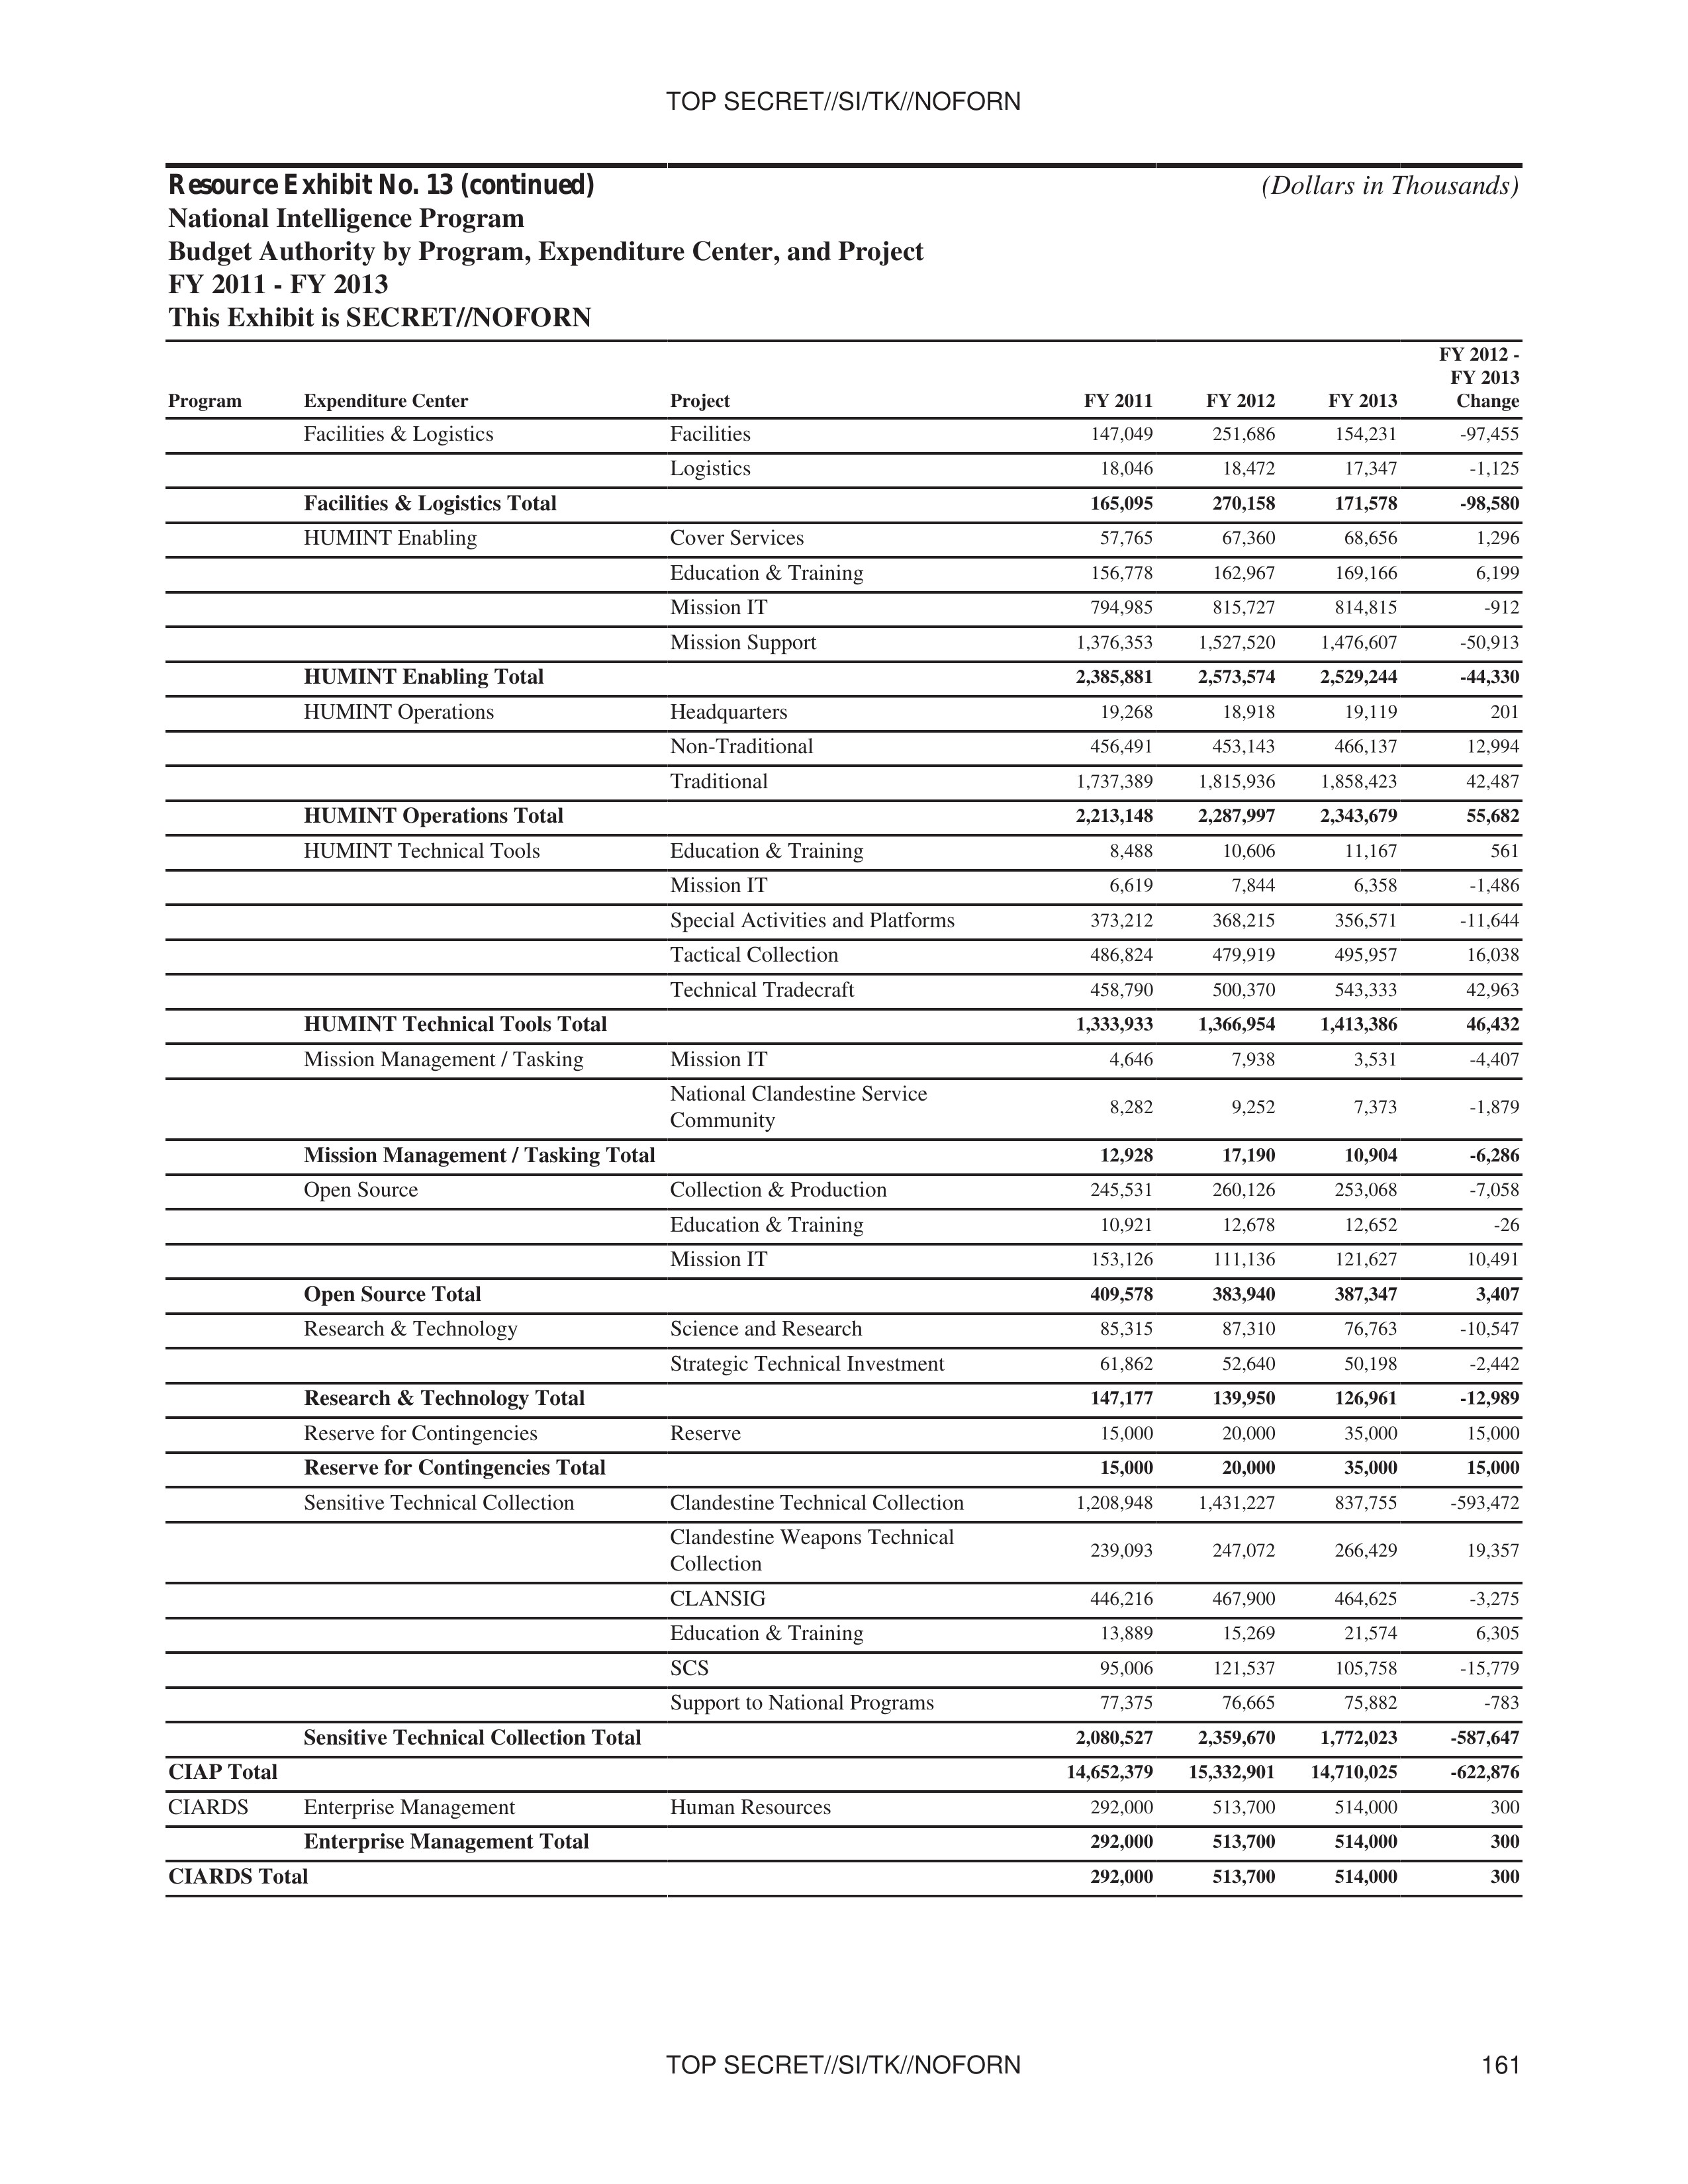
Resource Exhibit No. 13 (continued)
National Intelligence Program
Budget Authority by Program, Expenditure Center, and Project
FY 2011 - FY 2013
This Exhibit is SECRET//NOFORN
(Dollars in Thousands)
| Program | Expenditure Center | Project | FY 2011 | FY 2012 | FY 2013 | FY 2012 - FY 2013 Change |
|---|---|---|---|---|---|---|
| Facilities & Logistics | Facilities | 147,049 | 251,686 | 154,231 | -97,455 | |
| Logistics | 18,046 | 18,472 | 17,347 | -1,125 | ||
| Facilities & Logistics Total | 165,095 | 270,158 | 171,578 | -98,580 | ||
| HUMINT Enabling | Cover Services | 57,765 | 67,360 | 68,656 | 1,296 | |
| Education & Training | 156,778 | 162,967 | 169,166 | 6,199 | ||
| Mission IT | 794,985 | 815,727 | 814,815 | -912 | ||
| Mission Support | 1,376,353 | 1,527,520 | 1,476,607 | -50,913 | ||
| HUMINT Enabling Total | 2,385,881 | 2,573,574 | 2,529,244 | -44,330 | ||
| HUMINT Operations | Headquarters | 19,268 | 18,918 | 19,119 | 201 | |
| Non-Traditional | 456,491 | 453,143 | 466,137 | 12,994 | ||
| Traditional | 1,737,389 | 1,815,936 | 1,858,423 | 42,487 | ||
| HUMINT Operations Total | 2,213,148 | 2,287,997 | 2,343,679 | 55,682 | ||
| HUMINT Technical Tools | Education & Training | 8,488 | 10,606 | 11,167 | 561 | |
| Mission IT | 6,619 | 7,844 | 6,358 | -1,486 | ||
| Special Activities and Platforms | 373,212 | 368,215 | 356,571 | -11,644 | ||
| Tactical Collection | 486,824 | 479,919 | 495,957 | 16,038 | ||
| Technical Tradecraft | 458,790 | 500,370 | 543,333 | 42,963 | ||
| HUMINT Technical Tools Total | 1,333,933 | 1,366,954 | 1,413,386 | 46,432 | ||
| Mission Management / Tasking | Mission IT | 4,646 | 7,938 | 3,531 | -4,407 | |
| National Clandestine Service Community | 8,282 | 9,252 | 7,373 | -1,879 | ||
| Mission Management / Tasking Total | 12,928 | 17,190 | 10,904 | -6,286 | ||
| Open Source | Collection & Production | 245,531 | 260,126 | 253,068 | -7,058 | |
| Education & Training | 10,921 | 12,678 | 12,652 | -26 | ||
| Mission IT | 153,126 | 111,136 | 121,627 | 10,491 | ||
| Open Source Total | 409,578 | 383,940 | 387,347 | 3,407 | ||
| Research & Technology | Science and Research | 85,315 | 87,310 | 76,763 | -10,547 | |
| Strategic Technical Investment | 61,862 | 52,640 | 50,198 | -2,442 | ||
| Research & Technology Total | 147,177 | 139,950 | 126,961 | -12,989 | ||
| Reserve for Contingencies | Reserve | 15,000 | 20,000 | 35,000 | 15,000 | |
| Reserve for Contingencies Total | 15,000 | 20,000 | 35,000 | 15,000 | ||
| Sensitive Technical Collection | Clandestine Technical Collection | 1,208,948 | 1,431,227 | 837,755 | -593,472 | |
| Clandestine Weapons Technical Collection | 239,093 | 247,072 | 266,429 | 19,357 | ||
| CLANSIG | 446,216 | 467,900 | 464,625 | -3,275 | ||
| Education & Training | 13,889 | 15,269 | 21,574 | 6,305 | ||
| SCS | 95,006 | 121,537 | 105,758 | -15,779 | ||
| Support to National Programs | 77,375 | 76,665 | 75,882 | -783 | ||
| Sensitive Technical Collection Total | 2,080,527 | 2,359,670 | 1,772,023 | -587,647 | ||
| CIAP Total | 14,652,379 | 15,332,901 | 14,710,025 | -622,876 | ||
| CIARDS | Enterprise Management | Human Resources | 292,000 | 513,700 | 514,000 | 300 |
| Enterprise Management Total | 292,000 | 513,700 | 514,000 | 300 | ||
| CIARDS Total | 292,000 | 513,700 | 514,000 | 300 |
161 TOP SECRET//SI/TK//NOFORN
TOP SECRET//SI/TK//NOFORN
Resource Exhibit No. 13 (continued)
National Intelligence Program
Budget Authority by Program, Expenditure Center, and Project
FY 2011 - FY 2013
This Exhibit is SECRET//NOFORN
(Dollars in Thousands)
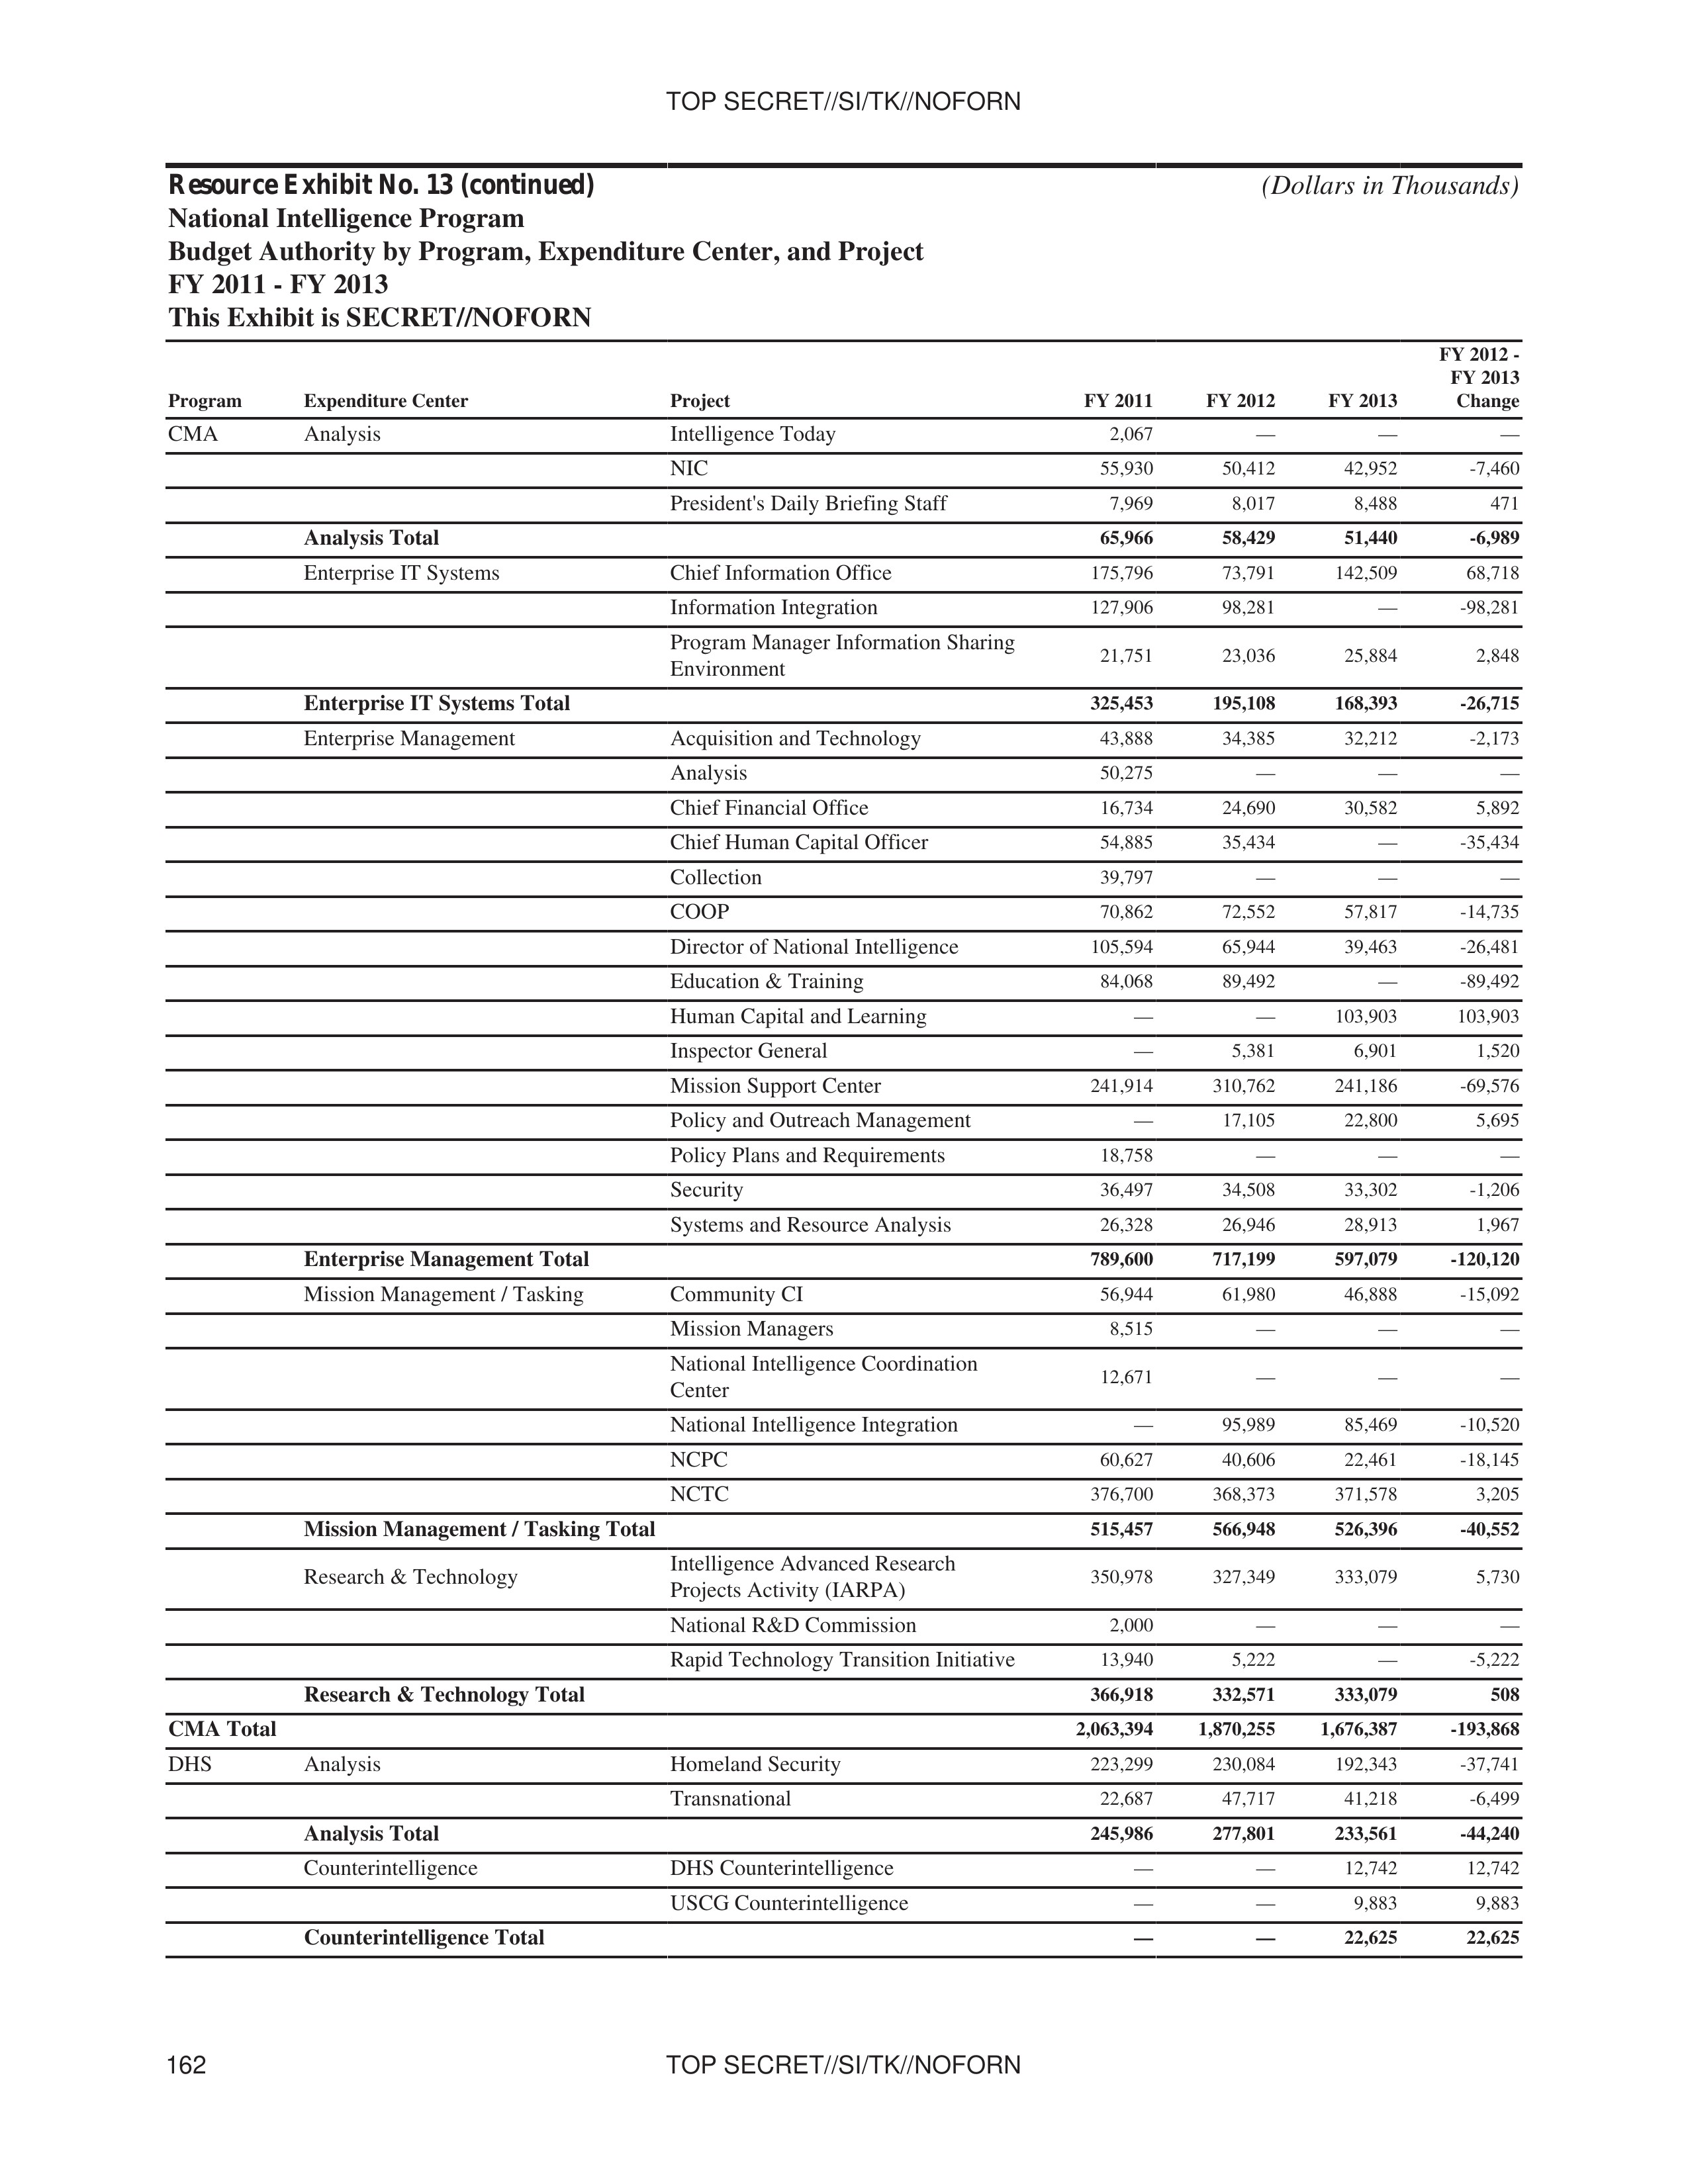
| Program | Expenditure Center | Project | FY 2011 | FY 2012 | FY 2013 | FY 2012-FY 2013 Change |
|---|---|---|---|---|---|---|
| CMA | Analysis | Intelligence Today | 2,067 | — | — | — |
| NIC | 55,930 | 50,412 | 42,952 | -7,460 | ||
| President's Daily Briefing Staff | 7,969 | 8,017 | 8,488 | 471 | ||
| Analysis Total | 65,966 | 58,429 | 51,440 | -6,989 | ||
| Enterprise IT Systems | Chief Information Office | 175,796 | 73,791 | 142,509 | 68,718 | |
| Information Integration | 127,906 | 98,281 | — | -98,281 | ||
| Program Manager Information Sharing Environment | 21,751 | 23,036 | 25,884 | 2,848 | ||
| Enterprise IT Systems Total | 325,453 | 195,108 | 168,393 | -26,715 | ||
| Enterprise Management | Acquisition and Technology | 43,888 | 34,385 | 32,212 | -2,173 | |
| Analysis | 50,275 | — | — | — | ||
| Chief Financial Office | 16,734 | 24,690 | 30,582 | 5,892 | ||
| Chief Human Capital Officer | 54,885 | 35,434 | — | -35,434 | ||
| Collection | 39,797 | — | — | — | ||
| COOP | 70,862 | 72,552 | 57,817 | -14,735 | ||
| Director of National Intelligence | 105,594 | 65,944 | 39,463 | -26,481 | ||
| Education & Training | 84,068 | 89,492 | — | -89,492 | ||
| Human Capital and Learning | — | — | 103,903 | 103,903 | ||
| Inspector General | — | 5,381 | 6,901 | 1,520 | ||
| Mission Support Center | 241,914 | 310,762 | 241,186 | -69,576 | ||
| Policy and Outreach Management | — | 17,105 | 22,800 | 5,695 | ||
| Policy Plans and Requirements | 18,758 | — | — | — | ||
| Security | 36,497 | 34,508 | 33,302 | -1,206 | ||
| Systems and Resource Analysis | 26,328 | 26,946 | 28,913 | 1,967 | ||
| Enterprise Management Total | 789,600 | 717,199 | 597,079 | -120,120 | ||
| Mission Management / Tasking | Community CI | 56,944 | 61,980 | 46,888 | -15,092 | |
| Mission Managers | 8,515 | — | — | — | ||
| National Intelligence Coordination Center | 12,671 | — | — | — | ||
| National Intelligence Integration | — | 95,989 | 85,469 | -10,520 | ||
| NCPC | 60,627 | 40,606 | 22,461 | -18,145 | ||
| NCTC | 376,700 | 368,373 | 371,578 | 3,205 | ||
| Mission Management / Tasking Total | 515,457 | 566,948 | 526,396 | -40,552 | ||
| Research & Technology | Intelligence Advanced Research Projects Activity (IARPA) | 350,978 | 327,349 | 333,079 | 5,730 | |
| National R&D Commission | 2,000 | — | — | — | ||
| Rapid Technology Transition Initiative | 13,940 | 5,222 | — | -5,222 | ||
| Research & Technology Total | 366,918 | 332,571 | 333,079 | 508 | ||
| CMA Total | 2,063,394 | 1,870,255 | 1,676,387 | -193,868 | ||
| DHS | Analysis | Homeland Security | 223,299 | 230,084 | 192,343 | -37,741 |
| Transnational | 22,687 | 47,717 | 41,218 | -6,499 | ||
| Analysis Total | 245,986 | 277,801 | 233,561 | -44,240 | ||
| Counterintelligence | DHS Counterintelligence | — | — | 12,742 | 12,742 | |
| USCG Counterintelligence | — | — | 9,883 | 9,883 | ||
| Counterintelligence Total | — | — | 22,625 | 22,625 |
162 TOP SECRET//SI/TK//NOFORN
TOP SECRET//SI/TK//NOFORN
Resource Exhibit No. 13 (continued)
National Intelligence Program
Budget Authority by Program, Expenditure Center, and Project
FY 2011 - FY 2013
This Exhibit is SECRET//NOFORN
(Dollars in Thousands)
| Program | Expenditure Center | Project | FY 2011 | FY 2012 | FY 2013 | FY 2012-FY 2013 Change |
|---|---|---|---|---|---|---|
| DHS (continued) | Enterprise Management | COOP | — | 1,458 | — | -1,458 |
| Security | 29,150 | 28,100 | 28,146 | 46 | ||
| Enterprise Management Total | 29,150 | 29,558 | 28,146 | -1,412 | ||
| DHS Total | 275,136 | 307,359 | 284,332 | -23,027 | ||
| DOD-FCIP | Analysis | CI | 34,283 | 37,974 | 38,162 | 188 |
| Analysis Total | 34,283 | 37,974 | 38,162 | 188 | ||
| Counterintelligence | CI Campaigns | 75,625 | 67,937 | 60,750 | -7,187 | |
| CI Operations | 21,336 | 23,678 | 34,116 | 10,438 | ||
| Defense Cyber Crime Center | 15,459 | 17,935 | 19,328 | 1,393 | ||
| Education & Training | 39,072 | 37,821 | 36,159 | -1,662 | ||
| Joint Terrorism Task Force | 14,867 | 14,765 | 14,553 | -212 | ||
| Mission Activities and Support | 233,254 | 216,835 | 223,734 | 6,899 | ||
| Mission IT | 38,354 | 37,322 | 36,364 | -958 | ||
| Research & Technology Protection | 6,424 | 6,454 | 20,513 | 14,059 | ||
| Counterintelligence Total | 444,391 | 422,747 | 445,517 | 22,770 | ||
| Enterprise IT Systems | Platforms | 12,774 | 15,578 | 16,183 | 605 | |
| Enterprise IT Systems Total | 12,774 | 15,578 | 16,183 | 605 | ||
| Enterprise Management | HQ Management | 24,199 | 21,382 | 20,613 | -769 | |
| Human Resources | 2,052 | 1,906 | 2,003 | 97 | ||
| Enterprise Management Total | 26,251 | 23,288 | 22,616 | -672 | ||
| Facilities & Logistics | Facilities | 21 | 6,308 | 6,482 | 174 | |
| Facilities & Logistics Total | 21 | 6,308 | 6,482 | 174 | ||
| DOD-FCIP Total | 517,720 | 505,895 | 528,960 | 23,065 | ||
| DOJ | Analysis | Computer Intrusions | 114,083 | 116,434 | — | -116,434 |
| Transnational | 759,564 | 771,582 | 849,037 | 77,455 | ||
| Analysis Total | 873,647 | 888,016 | 849,037 | -38,979 | ||
| Analysis Enabling | Linguists/Translators | 147,022 | 148,427 | 149,263 | 836 | |
| Analysis Enabling Total | 147,022 | 148,427 | 149,263 | 836 | ||
| Counterintelligence | CI Operations | 562,345 | 367,383 | 489,821 | 122,438 | |
| Counterintelligence Total | 562,345 | 367,383 | 489,821 | 122,438 | ||
| Enterprise IT Systems | Platforms | 54,670 | 40,960 | 40,034 | -926 | |
| Enterprise IT Systems Total | 54,670 | 40,960 | 40,034 | -926 | ||
| Enterprise Management | Education & Training | 41,029 | 46,429 | 45,945 | -484 | |
| HQ Management | 471,434 | 520,945 | 25,038 | -495,907 | ||
| Enterprise Management Total | 512,463 | 567,374 | 70,983 | -496,391 | ||
| Facilities & Logistics | Facilities | 60,311 | 43,480 | 43,256 | -224 | |
| Facilities & Logistics Total | 60,311 | 43,480 | 43,256 | -224 | ||
| HUMINT Operations | Traditional | 471,449 | 663,226 | 919,798 | 256,572 | |
| HUMINT Operations Total | 471,449 | 663,226 | 919,798 | 256,572 | ||
| Technical Operations | Computer Intrusions | — | — | 168,146 | 168,146 | |
| Technical Services | 296,422 | 291,929 | 289,620 | -2,309 | ||
| Technical Operations Total | 296,422 | 291,929 | 457,766 | 165,837 | ||
| DOJ Total | 2,978,329 | 3,010,795 | 3,019,958 | 9,163 | ||
| Energy | Analysis | Transnational | 105,862 | 126,288 | 142,771 | 16,483 |
| Analysis Total | 105,862 | 126,288 | 142,771 | 16,483 |
TOP SECRET//SI/TK//NOFORN 163
TOP SECRET//SI/TK//NOFORN
Resource Exhibit No. 13 (continued)
National Intelligence Program
Budget Authority by Program, Expenditure Center, and Project
FY 2011 - FY 2013
This Exhibit is SECRET//NOFORN
(Dollars in Thousands)
| Program | Expenditure Center | Project | FY 2011 | FY 2012 | FY 2013 | FY 2012-FY 2013 Change |
|---|---|---|---|---|---|---|
| Energy (continued) | Counterintelligence | CI Operations | 57,838 | 60,411 | 45,848 | -14,563 |
| Counterintelligence Total | 57,838 | 60,411 | 45,848 | -14,563 | ||
| Energy Total | 163,700 | 186,699 | 188,619 | 1,920 | ||
| GDIP | Analysis | Analytic Integrity & Standards | 1,081 | 1,592 | — | -1,592 |
| C4ISR Analysis | 98,071 | 100,670 | 133,051 | 32,381 | ||
| Medical | 19,791 | 21,689 | 20,218 | -1,471 | ||
| Military Forces & Weapons Analysis | 136,704 | 126,135 | 127,647 | 1,512 | ||
| Regional | 164,595 | 170,533 | 154,064 | -16,469 | ||
| S&T Analysis | 303,337 | 273,389 | 272,155 | -1,234 | ||
| Transnational | 228,118 | 247,175 | 210,191 | -36,984 | ||
| Warning | 15,319 | 17,725 | 17,370 | -355 | ||
| Analysis Total | 967,016 | 958,908 | 934,696 | -24,212 | ||
| Analysis Enabling | Analytic Tools | 86,927 | 130,671 | 154,132 | 23,461 | |
| Education & Training | 12,423 | 14,292 | 19,654 | 5,362 | ||
| Mission Support | 72,624 | 83,894 | 74,228 | -9,666 | ||
| Analysis Enabling Total | 171,974 | 228,857 | 248,014 | 19,157 | ||
| Enterprise IT Systems | Connectivity | 253,578 | 246,141 | 212,087 | -34,054 | |
| Enterprise Architecture & Planning | 40,793 | 44,046 | 44,594 | 548 | ||
| Information Assurance | 22,943 | 42,238 | 44,184 | 1,946 | ||
| Management & Support | 189,018 | 169,135 | 147,293 | -21,842 | ||
| Platforms | 458,876 | 428,516 | 385,254 | -43,262 | ||
| Enterprise IT Systems Total | 965,208 | 930,076 | 833,412 | -96,664 | ||
| Enterprise Management | Acquisition Management | 16,755 | 18,590 | 18,594 | 4 | |
| COOP | 4,683 | 4,926 | 5,438 | 512 | ||
| Education & Training | 62,849 | 66,190 | 74,278 | 8,088 | ||
| Finance | 60,478 | 66,589 | 74,315 | 7,726 | ||
| Foreign Relations & Liaison | 9,232 | 10,316 | — | -10,316 | ||
| HQ Management | 52,128 | 53,609 | 52,095 | -1,514 | ||
| Human Resources | 59,347 | 52,720 | 68,170 | 15,450 | ||
| Security | 86,005 | 87,659 | 108,791 | 21,132 | ||
| Enterprise Management Total | 351,477 | 360,599 | 401,681 | 41,082 | ||
| Facilities & Logistics | Facilities | 287,110 | 311,386 | 181,221 | -130,165 | |
| Logistics | 164,068 | 126,974 | 93,699 | -33,275 | ||
| Facilities & Logistics Total | 451,178 | 438,360 | 274,920 | -163,440 | ||
| HUMINT Enabling | Cover Services | 30,453 | 32,460 | 41,932 | 9,472 | |
| Education & Training | 50,450 | 45,519 | 46,034 | 515 | ||
| Mission IT | 19,679 | 8,490 | 8,936 | 446 | ||
| Mission Support | 258,833 | 303,126 | 310,263 | 7,137 | ||
| HUMINT Enabling Total | 359,415 | 389,595 | 407,165 | 17,570 | ||
| HUMINT Operations | Non-Traditional | 208,226 | 214,606 | 175,599 | -39,007 | |
| Special Mission Unit | 76,180 | 72,683 | — | -72,683 | ||
| Traditional | 109,835 | 114,395 | 129,037 | 14,642 | ||
| HUMINT Operations Total | 394,241 | 401,684 | 304,636 | -97,048 | ||
| MASINT | Close Access/Persistent Surveillance | 41,265 | 42,523 | 31,961 | -10,562 | |
| Directed Energy Weapons | 6,263 | 6,369 | 6,417 | 48 | ||
| Education & Training | 1,942 | 1,996 | 2,035 | 39 |
164 TOP SECRET//SI/TK//NOFORN
TOP SECRET//SI/TK//NOFORN
Resource Exhibit No. 13 (continued)
National Intelligence Program
Budget Authority by Program, Expenditure Center, and Project
FY 2011 - FY 2013
This Exhibit is SECRET//NOFORN
(Dollars in Thousands)
| Program | Expenditure Center | Project | FY 2011 | FY 2012 | FY 2013 | FY 2012-FY 2013 Change |
|---|---|---|---|---|---|---|
| GDIP (continued) | MASINT (continued) | Missiles | 201,268 | 224,609 | 171,822 | -52,787 |
| Mission IT | 6,930 | 6,905 | 8,712 | 1,807 | ||
| Mission Support | 37,654 | 47,113 | 38,208 | -8,905 | ||
| National Signatures Program | 10,930 | 6,463 | 1,270 | -5,193 | ||
| WMD | 268,164 | 285,611 | 275,425 | -10,186 | ||
| MASINT Total | 574,416 | 621,589 | 535,850 | -85,739 | ||
| Mission Management / Tasking | Collection Management | 34,775 | 49,873 | 63,573 | 13,700 | |
| Foreign Relations & Liaison | — | — | 10,147 | 10,147 | ||
| Mission Management Centers | 31,466 | — | — | — | ||
| Mission Management / Tasking Total | 66,241 | 49,873 | 73,720 | 23,847 | ||
| Open Source | Media Exploitation and Open Source | 238,768 | 212,548 | 210,685 | -1,863 | |
| Mission IT | 13,611 | 17,604 | 16,893 | -711 | ||
| Open Source Total | 252,379 | 230,152 | 227,578 | -2,574 | ||
| Research & Technology | Analysis Development | 6,840 | 5,904 | 4,659 | -1,245 | |
| IT Technology Insertion | 28,951 | 21,909 | 12,372 | -9,537 | ||
| MASINT Technology Development & Demonstration | 90,292 | 87,441 | 83,260 | -4,181 | ||
| Research & Technology Total | 126,083 | 115,254 | 100,291 | -14,963 | ||
| Sensitive Technical Collection | Maritime Surveillance | 87,381 | 90,636 | 88,179 | -2,457 | |
| Sensitive Technical Collection Total | 87,381 | 90,636 | 88,179 | -2,457 | ||
| GDIP Total | 4,767,009 | 4,815,583 | 4,430,142 | -385,441 | ||
| NGP | Analysis | AGI Analysis | 175,731 | 178,199 | 172,741 | -5,458 |
| Analytic Integrity & Standards | 601 | 554 | 580 | 26 | ||
| Deployed Operations | 75,611 | 88,723 | 101,935 | 13,212 | ||
| Homeland Security | 47,060 | 47,139 | 16,439 | -30,700 | ||
| Integrated Operations Center - Special Projects (IOC-SP) | 81,502 | 83,464 | 86,180 | 2,716 | ||
| International Operations | 31,291 | 40,677 | — | -40,677 | ||
| Regional | 331,943 | 336,689 | 269,649 | -67,040 | ||
| Transnational | 328,597 | 318,580 | 287,344 | -31,236 | ||
| Warning | 42,909 | 42,310 | 37,887 | -4,423 | ||
| Analysis Total | 1,115,245 | 1,136,335 | 972,755 | -163,580 | ||
| Commercial Remote Sensing | Mission Support | 15,956 | 15,251 | — | -15,251 | |
| Purchases | 220,718 | 205,670 | — | -205,670 | ||
| Commercial Remote Sensing Total | 236,674 | 220,921 | — | -220,921 | ||
| Enterprise IT Systems | Connectivity | 164,499 | 179,223 | 184,835 | 5,612 | |
| Data Handling & End-User Functionality | 212,535 | 213,359 | 186,702 | -26,657 | ||
| Information Assurance | 46,490 | 46,375 | 42,365 | -4,010 | ||
| Management & Support | 50,594 | 85,521 | 94,056 | 8,535 | ||
| Platforms | 49,728 | 66,141 | 78,485 | 12,344 | ||
| Systems Maintenance | 374,975 | 454,458 | 429,214 | -25,244 | ||
| Enterprise IT Systems Total | 898,821 | 1,045,077 | 1,015,657 | -29,420 | ||
| Enterprise Management | Acquisition Management | 42,003 | 39,937 | 38,142 | -1,795 | |
| COOP | 7,166 | 6,062 | 6,053 | -9 | ||
| Education & Training | 88,052 | 75,835 | 78,985 | 3,150 |
TOP SECRET//SI/TK//NOFORN 165
TOP SECRET//SI/TK//NOFORN
Resource Exhibit No. 13 (continued)
National Intelligence Program
Budget Authority by Program, Expenditure Center, and Project
FY 2011 - FY 2013
This Exhibit is SECRET//NOFORN
(Dollars in Thousands)
| Program | Expenditure Center | Project | FY 2011 | FY 2012 | FY 2013 | FY 2012-FY 2013 Change |
|---|---|---|---|---|---|---|
| NGP (continued) | Enterprise Management (continued) | Finance | 44,988 | 61,809 | 50,159 | -11,650 |
| GEOINT Functional Management | 24,074 | 21,841 | — | -21,841 | ||
| HQ Management | 54,788 | 45,778 | 48,032 | 2,254 | ||
| Human Resources | 46,966 | 41,118 | 43,340 | 2,222 | ||
| Security | 143,161 | 123,726 | 147,391 | 23,665 | ||
| Enterprise Management Total | 451,198 | 416,106 | 412,102 | -4,004 | ||
| Facilities & Logistics | Facilities | 516,506 | 219,792 | 112,716 | -107,076 | |
| Logistics | 2,632 | 2,902 | 2,754 | -148 | ||
| Facilities & Logistics Total | 519,138 | 222,694 | 115,470 | -107,224 | ||
| GEOINT Data | Commercial Imagery | — | — | 189,744 | 189,744 | |
| Source Assessment & ERM | — | — | 347,335 | 347,335 | ||
| GEOINT Data Total | — | — | 537,079 | 537,079 | ||
| Mission Management / Tasking | GEOINT Functional Management | — | — | 23,406 | 23,406 | |
| International Operations | — | — | 37,657 | 37,657 | ||
| Mission Readiness | 17,227 | 15,348 | 11,107 | -4,241 | ||
| Source Assessment & ERM | 364,828 | 330,725 | — | -330,725 | ||
| Source Tasking Operations & Management | 117,364 | 148,201 | 120,802 | -27,399 | ||
| Mission Management / Tasking Total | 499,419 | 494,274 | 192,972 | -301,302 | ||
| Mission Processing & Exploitation | Compartmented GEOINT Enterprise Services (CGES) | 69,539 | 92,148 | 68,499 | -23,649 | |
| NSG Enterprise Modernization | 261,759 | 202,416 | 218,695 | 16,279 | ||
| NSG Integrated Architecture Services | 119,781 | 185,238 | 213,519 | 28,281 | ||
| NSG Operational Systems | 446,191 | 415,591 | 516,352 | 100,761 | ||
| NSG Sensor Integration | 146,665 | 138,948 | 133,328 | -5,620 | ||
| NSG Systems Engineering | 220,717 | 215,872 | 222,910 | 7,038 | ||
| STIL | 22,817 | 34,484 | 42,648 | 8,164 | ||
| Mission Processing & Exploitation Total | 1,287,469 | 1,284,697 | 1,415,951 | 131,254 | ||
| Research & Technology | Advanced Radar GEOINT | 7,105 | — | — | — | |
| GEOINT Advanced Technology Development | 85,550 | 93,341 | 94,405 | 1,064 | ||
| GEOINT Basic & Applied Research | 70,631 | 74,867 | 70,591 | -4,276 | ||
| GEOINT Research and Technology Enablers | 56,695 | 53,257 | 51,948 | -1,309 | ||
| Research & Technology Total | 219,981 | 221,465 | 216,944 | -4,521 | ||
| NGP Total | 5,227,945 | 5,041,569 | 4,878,930 | -162,639 | ||
| NRP | Enterprise IT Systems | Connectivity | 545,666 | 456,333 | 486,588 | 30,255 |
| Enterprise Architecture & Planning | 22,710 | 36,653 | 36,215 | -438 | ||
| Information Assurance | 18,118 | 18,042 | 13,264 | -4,778 | ||
| Enterprise IT Systems Total | 586,494 | 511,028 | 536,067 | 25,039 | ||
| Enterprise Management | Acquisition Management | 38,641 | 28,831 | 26,114 | -2,717 | |
| COOP | 7,545 | 7,001 | 6,070 | -931 | ||
| Education & Training | 2,612 | 1,646 | 1,524 | -122 | ||
| Finance | 18,202 | 18,648 | 19,794 | 1,146 | ||
| HQ Management | 46,261 | 42,834 | 37,043 | -5,791 | ||
| Human Resources | 219,727 | 226,992 | 233,560 | 6,568 |
166 TOP SECRET//SI/TK//NOFORN
TOP SECRET//SI/TK//NOFORN
Resource Exhibit No. 13 (continued)
National Intelligence Program
Budget Authority by Program, Expenditure Center, and Project
FY 2011 - FY 2013
This Exhibit is SECRET//NOFORN
(Dollars in Thousands)
| Program | Expenditure Center | Project | FY 2011 | FY 2012 | FY 2013 | FY 2012-FY 2013 Change |
|---|---|---|---|---|---|---|
| NRO Mission Support | 60,739 | 45,050 | 88,312 | 43,262 | ||
| Security | 81,499 | 94,393 | 86,481 | -7,912 | ||
| Spectrum Management | 7,931 | 7,922 | 8,280 | 358 | ||
| Systems Engineering | 131,492 | 153,980 | 137,970 | -16,010 | ||
| Enterprise Management Total | 614,649 | 627,297 | 645,148 | 17,851 | ||
| Facilities & Logistics | Facilities | 98,964 | 169,761 | 165,382 | -4,379 | |
| Logistics | 49,840 | 46,229 | 54,476 | 8,247 | ||
| Facilities & Logistics Total | 148,804 | 215,990 | 219,858 | 3,868 | ||
| GEOINT EO | Enhanced Imagery System | 1,527,603 | 225,101 | 186,701 | -38,400 | |
| EO Integration & Support | 45,094 | 30,478 | 91,235 | 60,757 | ||
| Evolved Enhanced CRYSTAL System | — | 1,246,345 | 1,549,148 | 302,803 | ||
| GEOINT EO Total | 1,572,697 | 1,501,924 | 1,827,084 | 325,160 | ||
| GEOINT Radar | GEOINT Radar Sustainment | — | 10,000 | — | -10,000 | |
| Radar Integration & Support | 82,493 | 123,264 | 85,785 | -37,479 | ||
| TOPAZ (1-5) | 594,020 | 429,823 | 67,686 | -362,137 | ||
| TOPAZ Block 2 | — | — | 124,789 | 124,789 | ||
| GEOINT Radar Total | 676,513 | 563,087 | 278,260 | -284,827 | ||
| GEOINT/SIGINT Integrated Ground Development Engineering & Management | Command & Control | 246,469 | 179,965 | 54,850 | -125,115 | |
| Ground Integration & Support | 212,455 | 204,316 | 183,199 | -21,117 | ||
| Mission Control | — | — | 362,173 | 362,173 | ||
| Mission Framework | 268,307 | 351,013 | 198,814 | -152,199 | ||
| Mission Management | 175,776 | 149,761 | 35,913 | -113,848 | ||
| Mission Processing | 648,756 | 559,002 | 638,850 | 79,848 | ||
| GEOINT/SIGINT Integrated Ground Development Engineering & Management Total | 1,551,763 | 1,444,057 | 1,473,799 | 29,742 | ||
| Launch | Launch Capability Infrastructure | 282,051 | 269,500 | 286,000 | 16,500 | |
| Launch Operations & Engineering | 288,344 | 303,301 | 295,414 | -7,887 | ||
| Launch Vehicles | 330,092 | 377,771 | 679,073 | 301,302 | ||
| Launch Total | 900,487 | 950,572 | 1,260,487 | 309,915 | ||
| Mission Ground Stations | CONUS Operations | 792,345 | 804,687 | 700,673 | -104,014 | |
| OCONUS Operations | 271,709 | 280,233 | 276,593 | -3,640 | ||
| Station Integration & Support | 42,288 | 41,121 | 31,684 | -9,437 | ||
| Mission Ground Stations Total | 1,106,342 | 1,126,041 | 1,008,950 | -117,091 | ||
| Research & Technology | Research & Technology Development | 352,634 | 353,665 | 391,110 | 37,445 | |
| Research & Technology Support | 11,333 | 7,365 | 10,250 | 2,885 | ||
| Research & Technology Total | 363,967 | 361,030 | 401,360 | 40,330 | ||
| Sensitive Technical Collection | NRO Compartmented Programs | 653,027 | 750,955 | 482,027 | -268,928 | |
| Sensitive Technical Collection Total | 653,027 | 750,955 | 482,027 | -268,928 | ||
| SIGINT High | High Altitude Integration & Support | 127,402 | 126,674 | 105,152 | -21,522 | |
| NEMESIS 2 | 502,433 | — | — | — | ||
| ORION 7 | 9,130 | — | — | — | ||
| ORION 8 | 182,277 | 130,383 | 37,967 | -92,416 | ||
| RAVEN 5/6 | — | — | — | — |
167 TOP SECRET//SI/TK//NOFORN
TOP SECRET//SI/TK//NOFORN
Resource Exhibit No. 13 (continued)
National Intelligence Program
Budget Authority by Program, Expenditure Center, and Project
FY 2011 - FY 2013
This Exhibit is SECRET//NOFORN
(Dollars in Thousands)
| Program | Expenditure Center | Project | FY 2011 | FY 2012 | FY 2013 | FY 2012-FY 2013 Change |
|---|---|---|---|---|---|---|
| SIGINT High Altitude Replenishment Program (SHARP) | 948,443 | 832,977 | 784,338 | -48,639 | ||
| SIGINT High Total | 1,769,685 | 1,090,034 | 927,457 | -162,577 | ||
| SIGINT Low | INTRUDER 11/12 | — | — | — | — | |
| INTRUDER 5/6 | 231,484 | 112,570 | — | -112,570 | ||
| INTRUDER 7/8 | 489,969 | 439,948 | 323,427 | -116,521 | ||
| Low Altitude Integration & Support | 122,197 | 113,563 | 122,932 | 9,369 | ||
| SIGINT Low Total | 843,650 | 666,081 | 446,359 | -219,722 | ||
| Space Communications | Mission System Encryption | 26,425 | 29,174 | 30,073 | 899 | |
| QUASAR R/S - 17/18 | 26,143 | — | — | — | ||
| QUASAR R/S - 19 | 7,223 | — | — | — | ||
| QUASAR R/S 20/21 | 252,337 | 263,603 | 435,300 | 171,697 | ||
| QUASAR R/S 22/23 | — | 27,573 | 80,781 | 53,208 | ||
| Relay Readiness and Launch | 80,264 | 42,216 | 16,919 | -25,297 | ||
| Space Communications Integration & Support | 91,351 | 78,791 | 99,914 | 21,123 | ||
| Space Operations Development Segment | 129,924 | 161,882 | 152,080 | -9,802 | ||
| Space Communications Total | 613,667 | 603,239 | 815,067 | 211,828 | ||
| NRP Total | 11,401,745 | 10,411,335 | 10,321,923 | -89,412 | ||
| SRP | Enterprise Management | (Project P_MA) | 31,955 | 28,326 | 28,682 | 356 |
| COOP | 3,441 | 500 | 500 | — | ||
| Enterprise Management Total | 35,396 | 28,826 | 29,182 | 356 | ||
| Research & Technology | (Project P_APP) | 81,255 | 65,330 | 56,377 | -8,953 | |
| Research & Technology Total | 81,255 | 65,330 | 56,377 | -8,953 | ||
| Sensitive Technical Collection | (Project P_GBG) | 109,463 | 123,712 | 119,918 | -3,794 | |
| (Project P_O_ST) | 95,625 | 107,695 | 103,258 | -4,437 | ||
| (Project P_RUSH) | 198,086 | 195,263 | 197,312 | 2,049 | ||
| (Project P_SRC) | 129,486 | 90,695 | 90,159 | -536 | ||
| Sensitive Technical Collection Total | 532,660 | 517,365 | 510,647 | -6,718 | ||
| Special Source Access | (Project P_AC) | 424,291 | 329,096 | 239,779 | -89,317 | |
| (Project P_CCBS) | 24,978 | — | — | — | ||
| (Project P_O_SA) | 51,727 | 48,480 | 49,357 | 877 | ||
| (Project P_SCOL) | 316,485 | 278,654 | 248,262 | -30,392 | ||
| Special Source Access Total | 817,481 | 656,230 | 537,398 | -118,832 | ||
| SRP Total | 1,466,792 | 1,267,751 | 1,133,604 | -134,147 | ||
| State | Analysis | Analytic Integrity & Standards | 143 | 143 | 144 | 1 |
| Transnational | 44,715 | 44,552 | 44,968 | 416 | ||
| Analysis Total | 44,858 | 44,695 | 45,112 | 417 | ||
| Analysis Enabling | Mission Support | 13,299 | 13,241 | 13,930 | 689 | |
| Analysis Enabling Total | 13,299 | 13,241 | 13,930 | 689 | ||
| Enterprise IT Systems | Management & Support | 10,616 | 10,267 | 13,613 | 3,346 | |
| Enterprise IT Systems Total | 10,616 | 10,267 | 13,613 | 3,346 | ||
| State Total | 68,773 | 68,203 | 72,655 | 4,452 | ||
| Treasury | Analysis | Transnational | 22,568 | 22,569 | 22,743 | 174 |
| Analysis Total | 22,568 | 22,569 | 22,743 | 174 |
168 TOP SECRET//SI/TK//NOFORN
TOP SECRET//SI/TK//NOFORN
Resource Exhibit No. 13 (continued)
National Intelligence Program
Budget Authority by Program, Expenditure Center, and Project
FY 2011 - FY 2013
This Exhibit is SECRET//NOFORN
(Dollars in Thousands)
| Program | Expenditure Center | Project | FY 2011 | FY 2012 | FY 2013 | FY 2012-FY 2013 Change |
|---|---|---|---|---|---|---|
| Enterprise IT Systems | Platforms | 4,854 | 4,554 | 4,554 | — | |
| Enterprise IT Systems Total | 4,854 | 4,554 | 4,554 | — | ||
| Treasury Total | 27,422 | 27,123 | 27,297 | 174 | ||
| National Intelligence Program Total | 54,639,507 | 53,873,203 | 52,554,597 | -1,318,606 |
TOP SECRET//SI/TK//NOFORN 169
Related Documents
-
-
-
“Black Budget” — FY 2013 Congressional Budget Justification/National Intelligence Program, pp. 360-364 (February 2012) [pdf]
The "Human Language Technology (HLT) Research" section of the FY 2013 "Black Budget" details a specialized research project focused on creating "force multipliers" for the NSA workforce through automated speech-to-text, machine translation, and content extraction. With a requested budget of $29.4 million, the project aims to bridge the gap between foundational academic research (via Johns Hopkins University) and the practical exploitation of the volume and velocity of global SIGINT.
Programs: HLT -
“Black Budget” — FY 2013 Congressional Budget Justification/National Intelligence Program, p. 262 (February 2012) [pdf]
This excerpt from the Fiscal Year 2013 Congressional Budget Justification (the "Black Budget") details the NSA's financial and performance metrics for "Analytics Modernization," specifically focusing on the transition to high-volume, automated speech-to-text systems. It records the decommissioning of legacy voice processing systems (VoiceRT) in favor of more robust, scalable capabilities aimed at rendering millions of intercepted voice files searchable via text queries and paired dialogue transcription.
Programs: VoiceRT -
FY2013 Congressional Budget Justification Bin Laden Excerpts [pdf]
This document includes excerpts from the 2013 National Intelligence Program budget justification describing the integrated intelligence community efforts that led to locating and raiding Osama bin Laden's compound, detailing contributions from NSA's signal intelligence, CIA's geolocation analysis, NGA's imagery modeling, and post-raid forensic DNA confirmation.
People: bin Laden, Osama