Tag: chart analysis 1 document
Search documents matching “chart analysis” →Free-text subjects the curators added. Unlike the other axes these are not necessarily from the documents' own vocabulary, so they are the loosest thing to browse by (and the most forgiving).
Sort: Title
Documents
-
WINDSTOP - Last 30 Days [pdf]
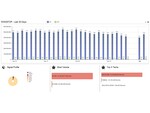
The WINDSTOP report shows massive NSA collection activity over a 30-day period, with daily DNI (Digital Network Intelligence) and DNR (Dialed Number Recognition) records reaching up to 600 million per day. Most data volume came from DS-300 and DS-200B collection points, processed primarily through XKEYSCORE and TURMOIL, and included a mix of signal types such as PCS, INMAR, MCIP, VSAT, and PSTN. The chart follows the same structure as BOUNDLESSINFORMANT, the NSA’s global SIGINT visualization tool, using bar and pie charts to track and categorize collection volume by signal type, SIGAD, and processing system.